
Features & Experiments
Evaluate the performance of your app as you implement new features and conduct experiments
There are different cases where you end up having different feature flags or experiments for different users. For example, if you are:
- Controlling your rollout by enabling features to a % of your users to monitor Performance and Stability
- Creating and testing different mobile onboarding experiences concurrently
- Testing different landing pages for your mobile app
- Implementing new features with different UI
Through the “Experiments” API you can keep track of your experiments and its impact on Bug Reports, Crash Reports and App Performance for each user and even filter by them. This can help you in:
- Detecting if the the potential source of any latency or issues in the app is introduced by different variants of the experiment or new features
- Having visibility for the latencies of your variants over different metrics
- Filtering by your experimental variants to analyze if they impact your performance or cause crashes
- Debugging issues faster by understanding if the experimental values contributed in a issue
Set-up Features & Experiments
Adding Experiments
Simply, to track your feature flags or experiments in the dashboard, use the next method.
Instabug.addExperiments(["exp1"])
[Instabug addExperiments:@[@"exp1"]];
Instabug.addExperiments(List<String> experiments);
Instabug.addExperiments(List<String> experiments)
Instabug.addExperiments(['exp1']);
Instabug.addExperiments(['exp1']);
Notes:
- Experiment Quantity: You can create a maximum of 600 experiments. Ensure that each experiment is unique, and duplicates are not permitted.
- Experiment Naming: Each experiment name should not exceed 140 characters. Note that experiment names are case-insensitive.
- Experiment Persistence: Experiments persist beyond individual sessions and are not automatically removed at the end of a session. Additionally, calling the logOut function does not impact the existence of the experiment. The experiment is only removed when you call the removing method or the clearing method.
Example Usage
Below is an example of where in your code you would use experiments. In this example, you are experimenting with feature logic that controls whether or not the user has a Dark Mode toggle available.
if darkModeToggleEnabled {
  Instabug.addExperiments(["darkModeToggleAvailable"])
  // Display dark mode toggle
}
Experiments and Team Ownership
If you have a team who is responsible for a specific feature flag or an experiment, you can automatically assign them the relevant issues and forward them to their favorite tool. For more details on Team Ownership, click here
In the screenshot below, we wanted to assign crashes relevant to the experiment Recommendations_enabled to the team responsible for this feature and auto-forward it to their Jira board

Removing Experiments
If your experiment is concluded or you would like to simply remove it, you can use this method:
Instabug.removeExperiments(["Recommendations_enabled"])
[Instabug removeExperiments:@[@"exp2"]];
Instabug.removeExperiments(List<String> experiments);
Instabug.removeExperiments(List<String> experiments);
Instabug.removeExperiments(['exp1']);
Instabug.removeExperiments(['exp1']);
Clearing Experiments
You can use the below method to clear all the experiments from your reports:
Instabug.clearAllExperiments()
[Instabug clearAllExperiments];
Instabug.clearAllExperiments();
Instabug.clearAllExperiments();
Instabug.clearAllExperiments();
Instabug.clearAllExperiments();
Features and Experiments Dashboard
Explore the Features and Experiments Dashboard for a detailed look into the performance metrics of your feature flags and experiments.
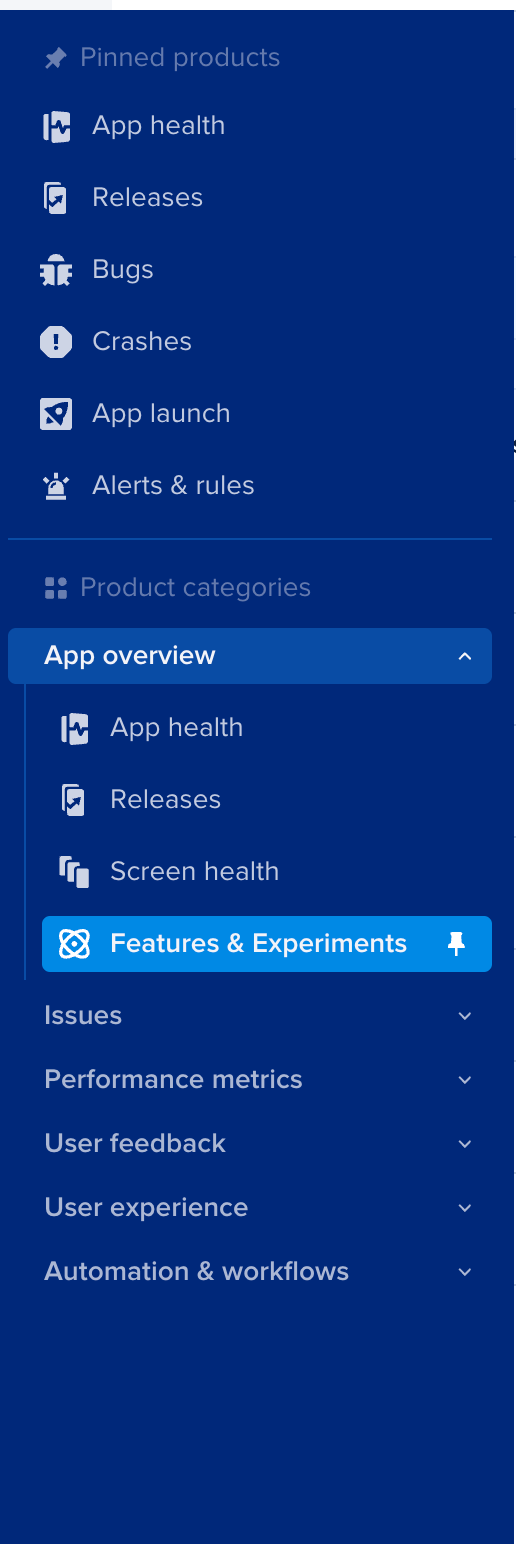
You can find it in the nav bar under “App overview”
Gain key insights
You are able to view different metrics within the page that allow you to gain more key insights like:
- Apdex Score: An overall Apdex score is calculated based on Crashes, App Hangs, and Force Restarts occurring in sessions with this feature.
- Crash-Free Users Rate: The percentage of users experiencing this feature without any crashes relative to the total number of users using this feature.
- Crash-Free Sessions Rate: The percentage of sessions with this feature that are crash-free out of the total sessions involving this feature.
- Total Sessions: View the total number of sessions where this feature flag was detected, providing an overview of its usage.
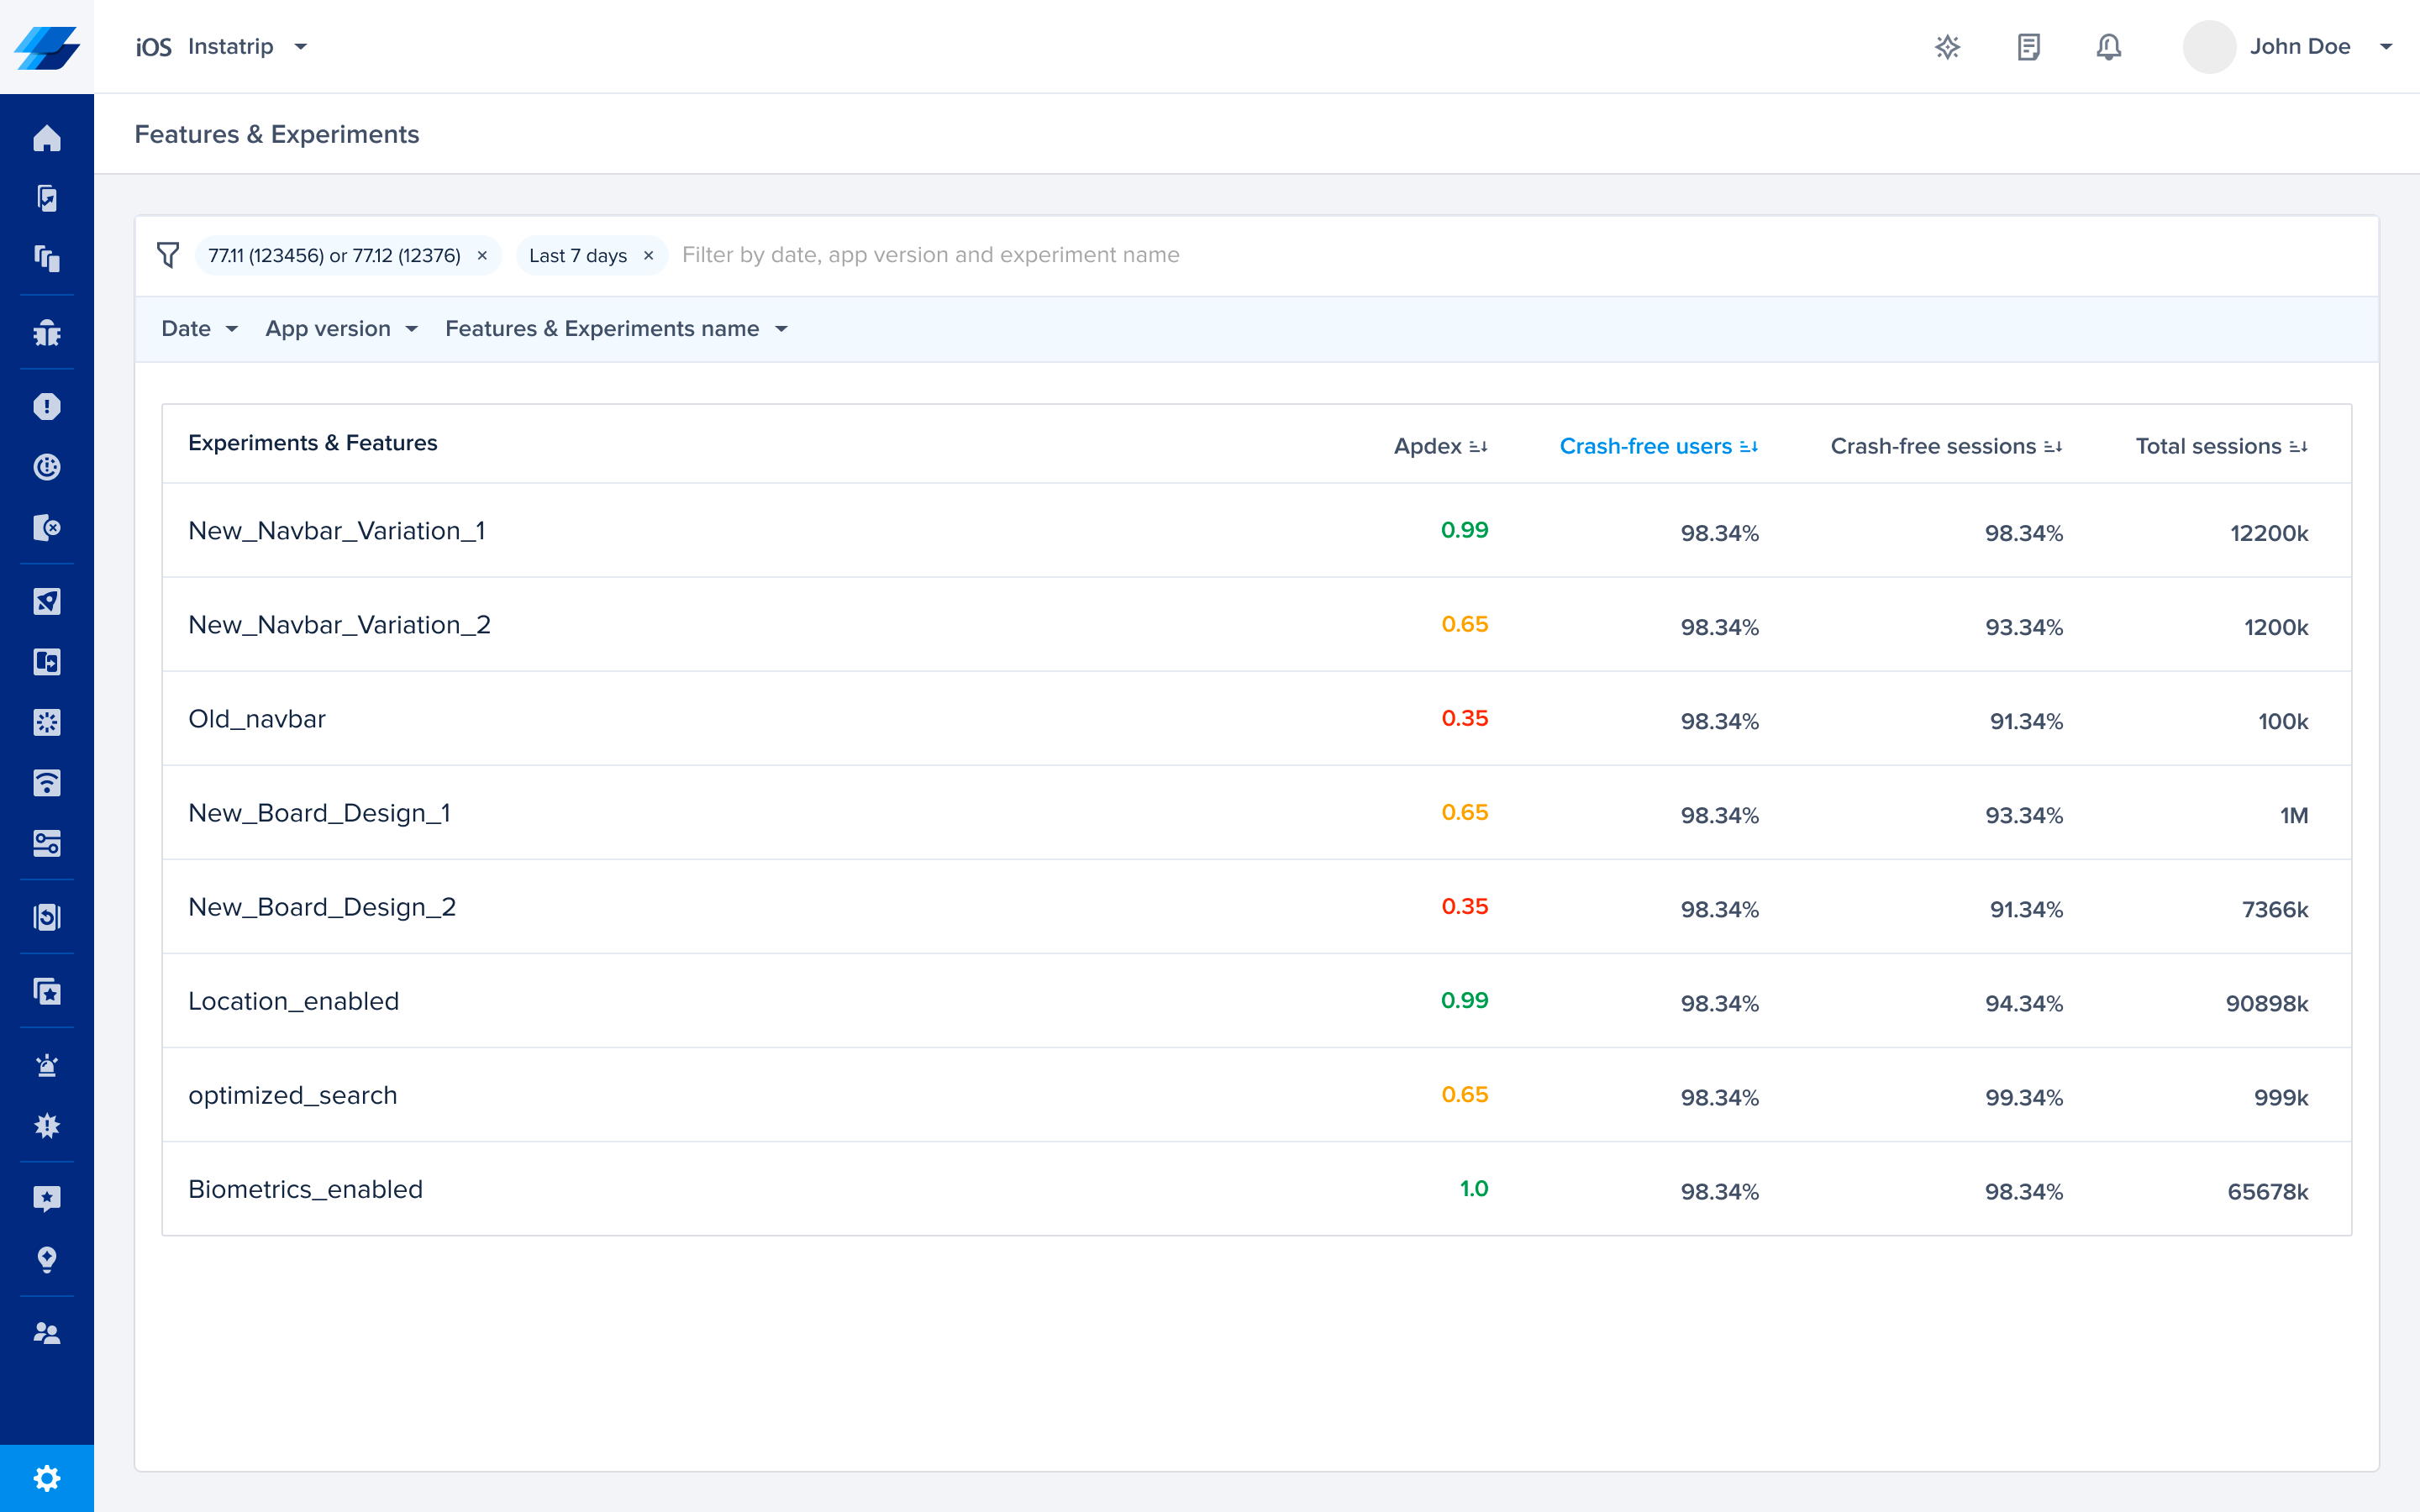
Compare Feature Variants
- Easily compare different feature variants by filtering the dashboard using the Feature/Experiment name and selecting the ones you're interested in.
- You can leverage the dashboard to make informed decisions on the best-performing variants.
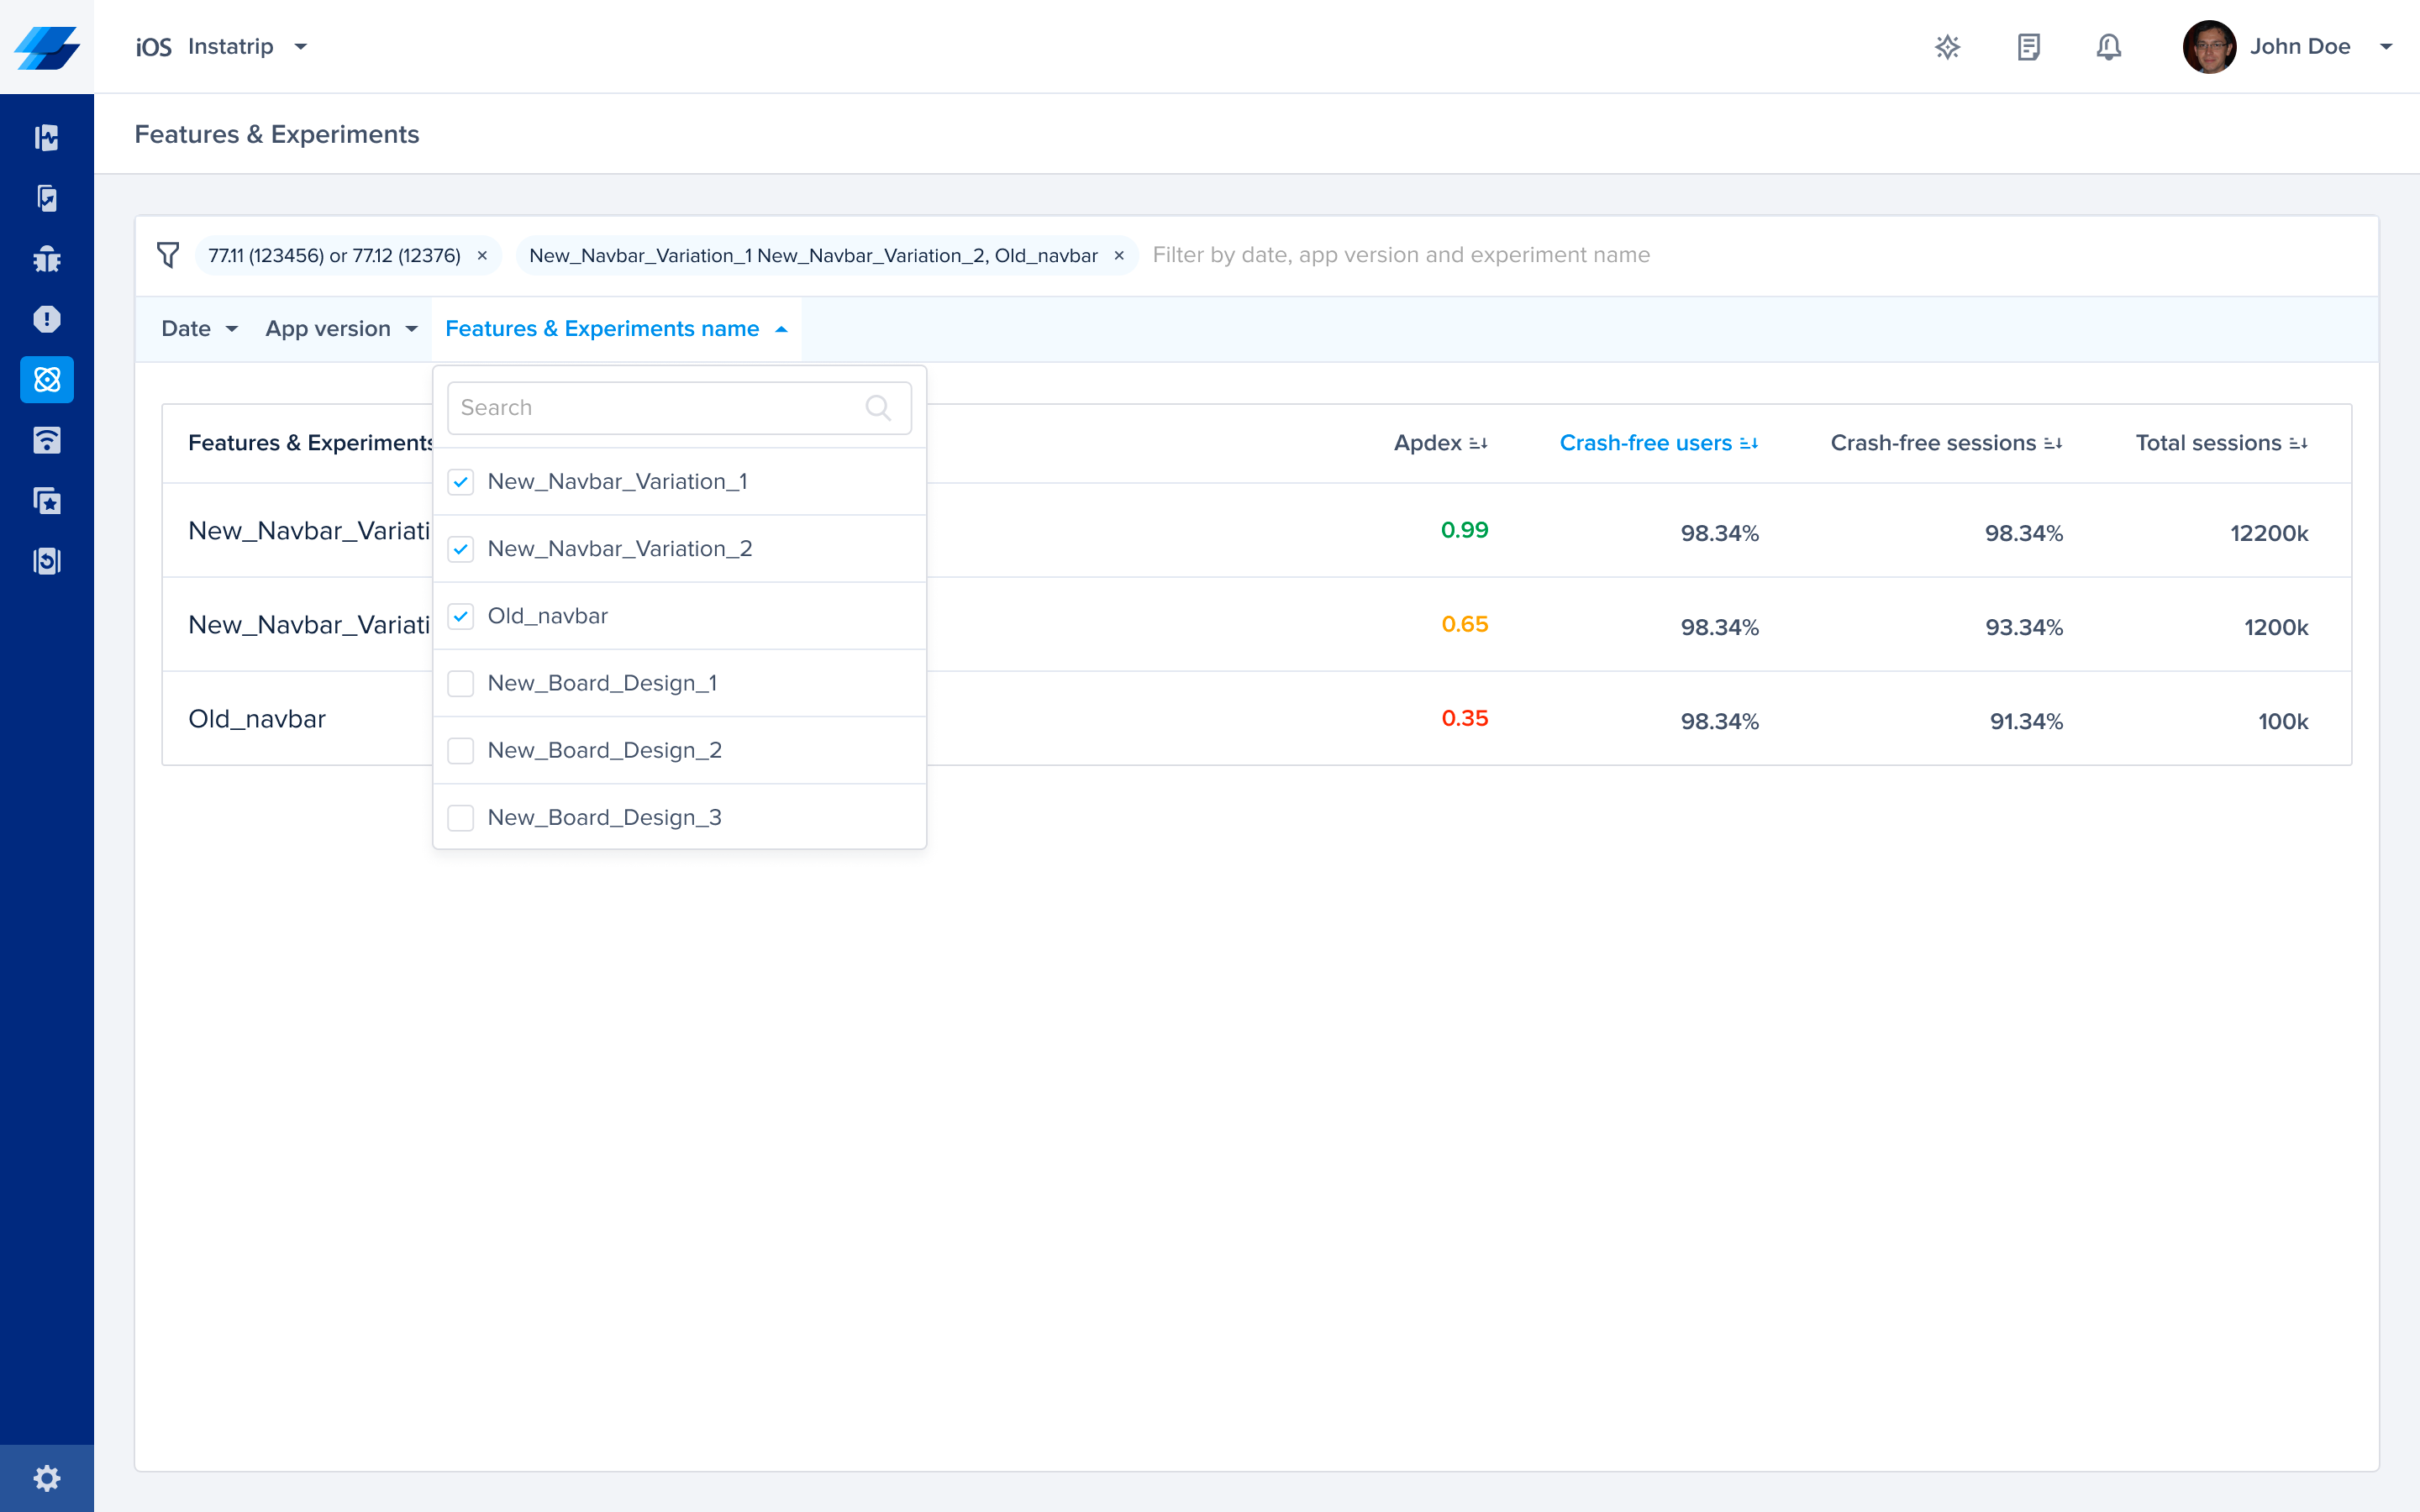
Details Page: Feature/Experiment Drill Down
-
Insights Table
-
Explore a detailed breakdown of your feature or experiment through the Insights Table, providing a nuanced understanding of its performance. Here's a comprehensive overview of each metric:
- Apdex: Combining Crashes, App Hangs, and Force Restarts within sessions featuring this specific feature gives you an overall performance indicator.
- Crash-Free Users Rate: The percentage of users experiencing this feature without any crashes relative to the total number of users using this feature.
- Crash-Free Sessions Rate: The percentage of sessions with this feature that is crash-free out of the total sessions involving this feature.
- Total Sessions: View the total number of sessions where this feature flag was detected, providing an overview of its usage.
- App Hang-Free Sessions: The percentage of sessions without any App hangs out of the total sessions involving this feature.
- Force-Restart Free Sessions: Understand the percentage of sessions that ended in a force restart of the app out of the total sessions involving this feature.
-
If you click on any of the metrics, you’ll be redirected to the list of issues where filtered by this experiment.
-
Compare this experiment against all users across all metrics to identify potential issues or improvements compared to your baseline.
Insights Table
-
-
Crashes Section
-
Crashes Tab:
- This section provides details on any crash that occurred at least once with this feature.
-
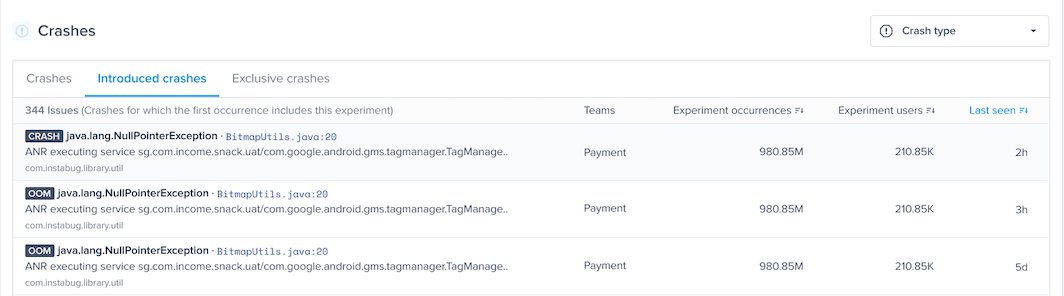
Introduced Crashes Tab:
- Crashes for which the first occurrence includes this feature. This can help you understand the impact of the feature on the introduction of new crashes.
-
Exclusive Crashes Tab:
- Crashes that exclusively happened in sessions containing this feature and never occurred without it. This can help identify the issues associated specifically with this feature.
-
Crashes Section
By examining both the Insights Table and the Crashes Section, you gain a comprehensive understanding of your feature or experiment, enabling you to address issues and make sure your users have a smooth experience with this new feature!
Experiments in Performance Monitoring
Once you add the API to your code, you will be able to view the experiments in the patterns section of Cold App Launch, Screen Loading, and UI Hangs

You can see the different latencies of your metric in correlation with the experimental variant. For example, in the previous screenshot, users who had guest_mode enabled had a very different Apdex score, p50 and p95 latencies.
You can also isolate your experiment by filtering with a specific experiment value for further analysis to understand if they are impacting the latency of App launch, Screen Loading or UI hangs.
If you filter by guest_mode and No experiments as shown on the following screenshot, the No Experiments presents occurrences without any experiments applied. You can also filter by one or more experimental values.

The No Experiments selection will help you spot and compare any difference in performance in each metric.

Experiments in Crash Reporting
Rolling out new features or doing modifications in your code can increase the number of errors you are seeing. By analyzing how different experiment variants are contributing to your crashes, you can minimize the debugging efforts and team members can save time.
For example, if you just rolled out a new recommendation feature for a subset of your users, you can view all the crashes that occurred to the users who had this feature enabled by using the filters.
In the screenshot below, we filtered by experiment Recommendations_enabled, to view the relevant crashes

You can also view the experiment variants attached to each crash report on your dashboard in the patterns section of a crash.

Updated 3 months ago