
WebViews Screen Loading for Android
Measure the loading performance of your WebViews with Web Vitals
WebViews are components that embed web content within native mobile applications. They can be an easy and cost-effective alternative to redesigning some pages from scratch for your mobile app.
Instabug automatically captures the time it takes for your WebViews to load. This includes both the time to load the native screen that hosts the WebView and the time it takes the WebView itself to load along with its content.
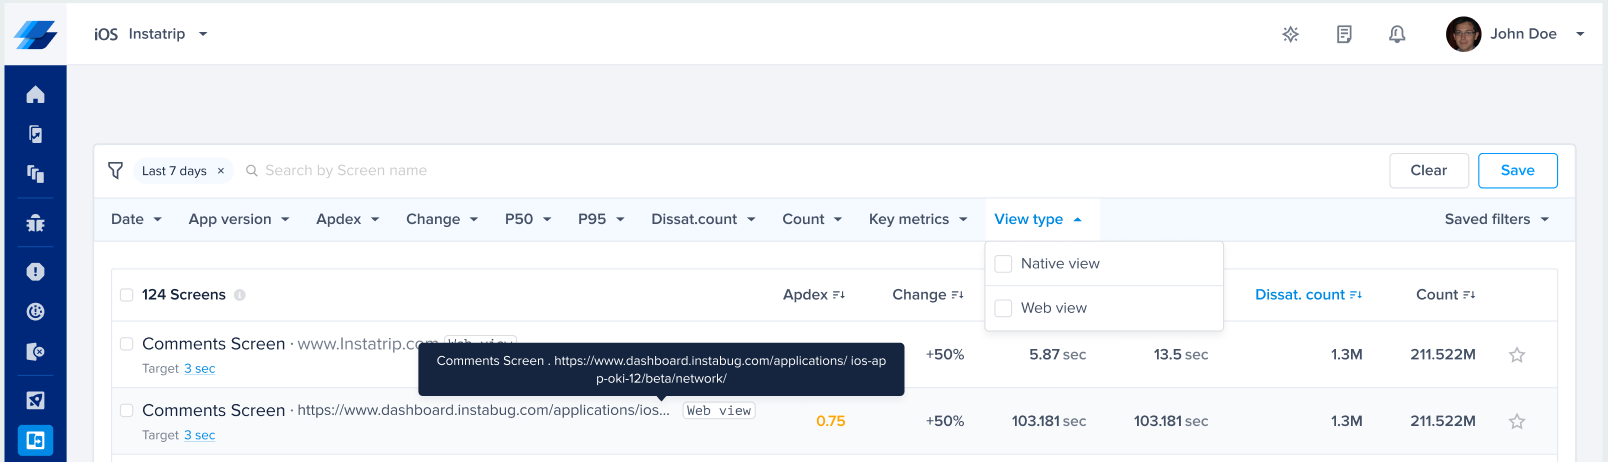
WebViews are clearly tagged, along with their URL, for easy identification. You can also use filters to only see native views or WebViews.
Instabug only detects WebViews that fill the majority (<75%) of the native screens they are hosted in. Smaller WebViews such as banners or small ads will not be captured.
Instabug only supports the
WebViewAndroid Class. No other libraries or methods of serving web content is supported.
Web Vitals
Web Vitals are a suite of user-centric performance metrics developed by Google that measure the loading speed, interactivity, and visual stability of web pages. Google considers Core Web Vitals to be the most important of these metrics and should be “tracked by every developer for every website”, these include:
- Largest Contentful Paint (LCP): measures loading performance. The time it takes to render the largest image or text block visible within the webpage.
- First Input Delay (FID): measures interactivity. The time between the user first trying to interact with the page and the webpage starting to process that interaction.
- Cumulative Layout Shift (CLS): measures visual stability. A measure of how much visible elements on a page shift unexpectedly during the page’s lifespan.
You can learn more about Web Vitals here.
Instabug automatically captures Core Web Vitals and displays them for all detected WebViews in in your application. These vitals are benchmarked according to Google’s recommendations.
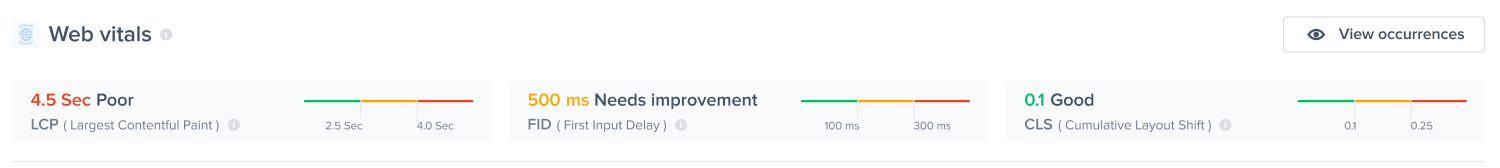
Times shown on the top of the Screen Loading pages are the P75 of each Core Web Vital
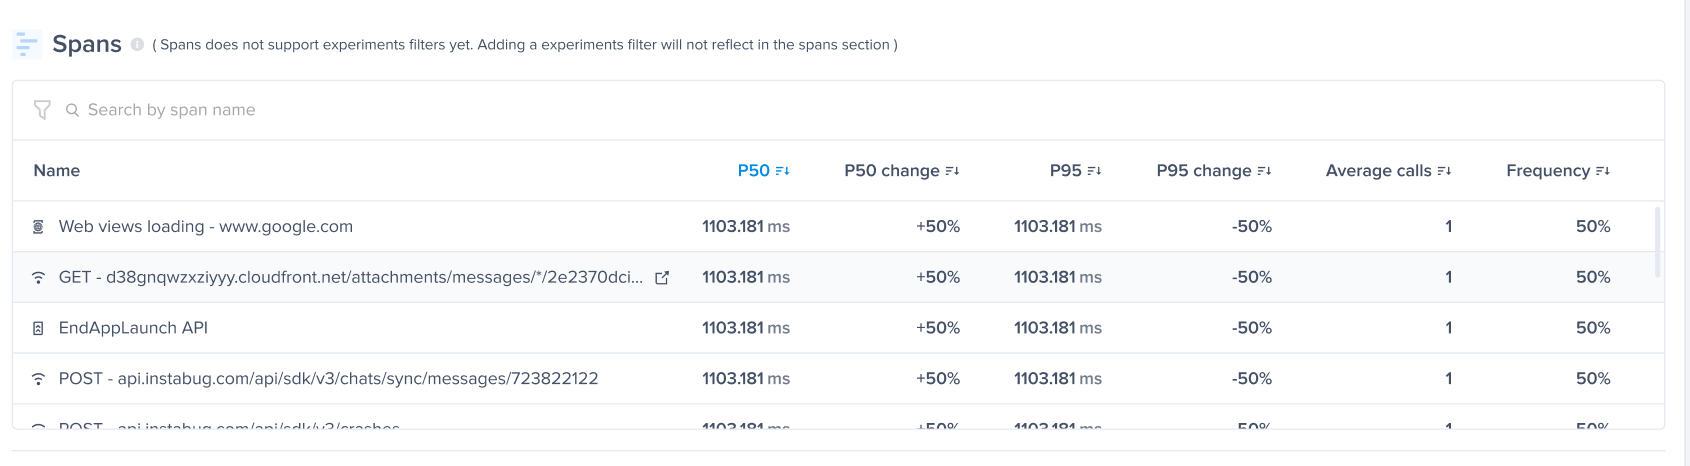
Spans
Because total Screen Loading time only tells half the story, you can see in the Spans breakdown how each span contributes to the total screen loading time. The WebViews Loading span shows the time it took to load the WebView and its content, along with the WebView URL for quick identification or debugging. You can also check all the other spans associated with the native components of the screen, such as native loading stages or network calls, so you can find the bottleneck wherever it may be.
Network calls originating from within the WebView will not be captured as they are invisible to the SDK. Only network calls originating from the native app itself will be shown.
Updated 2 months ago