Crash Report Content
This page covers the content found in crash reports in the Instabug dashboard.
Each crash report reaches your dashboard with all the information you need to resolve it.
Crash Overview
The crashes page in your dashboard lists all of your crash reports. When you select one, it opens the crash overview page, where you can find many details.

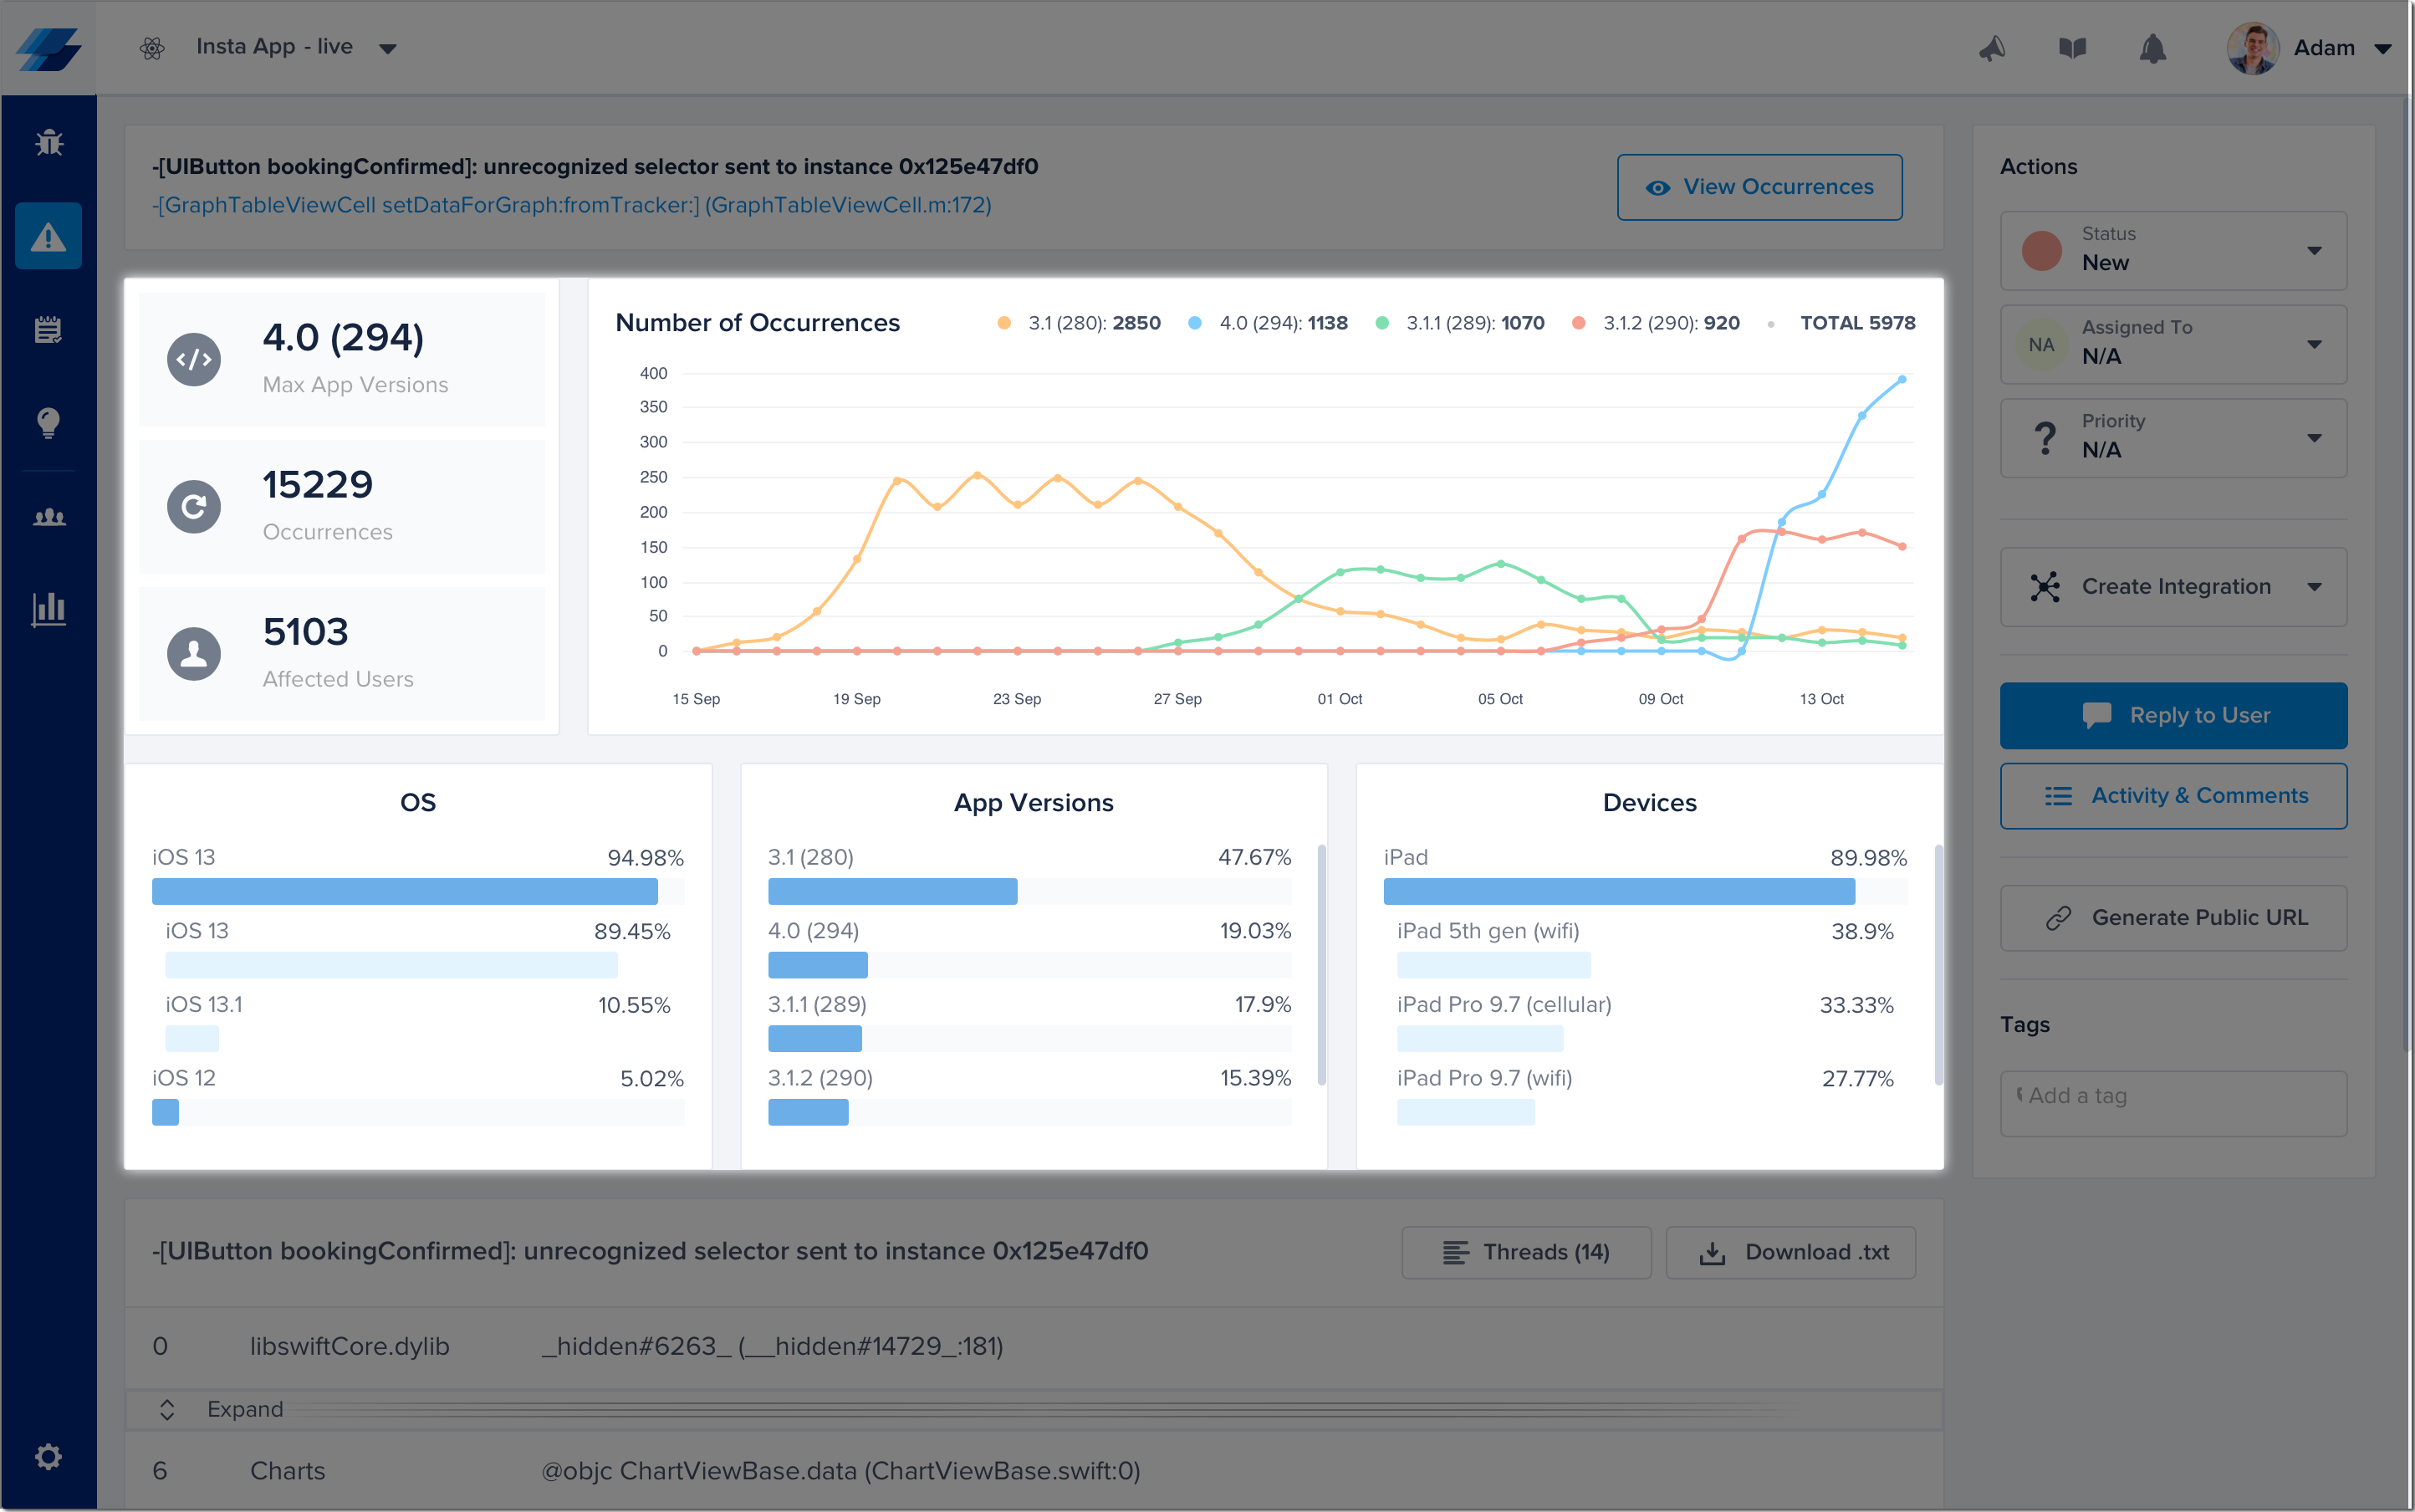
An example of a crash report in the Instabug dashboard.
The graph above depicts the number of crashing sessions caused by this particular crash against the days of the previous month. Each color of line represents a different app version.
Here are what the details in the crash page cover:
- Exception & Crash Cause: Main application frame that caused the crash.
- Max App Version: The highest version of the app where the crash occurred.
- Occurrences: The number of times this crash has occurred.
- Affected Users: The number of unique users that experienced this crash.
- No. of Occurrences Per Day: Shows number of crashes on the Y-axis and date on the X-axis.
- OS: A breakdown of the percentage of crashes by OS version.
- App Versions: A breakdown of the percentage of crashes by app version.
- Devices: A breakdown of the percentage of crashes by device model.
Stack Trace
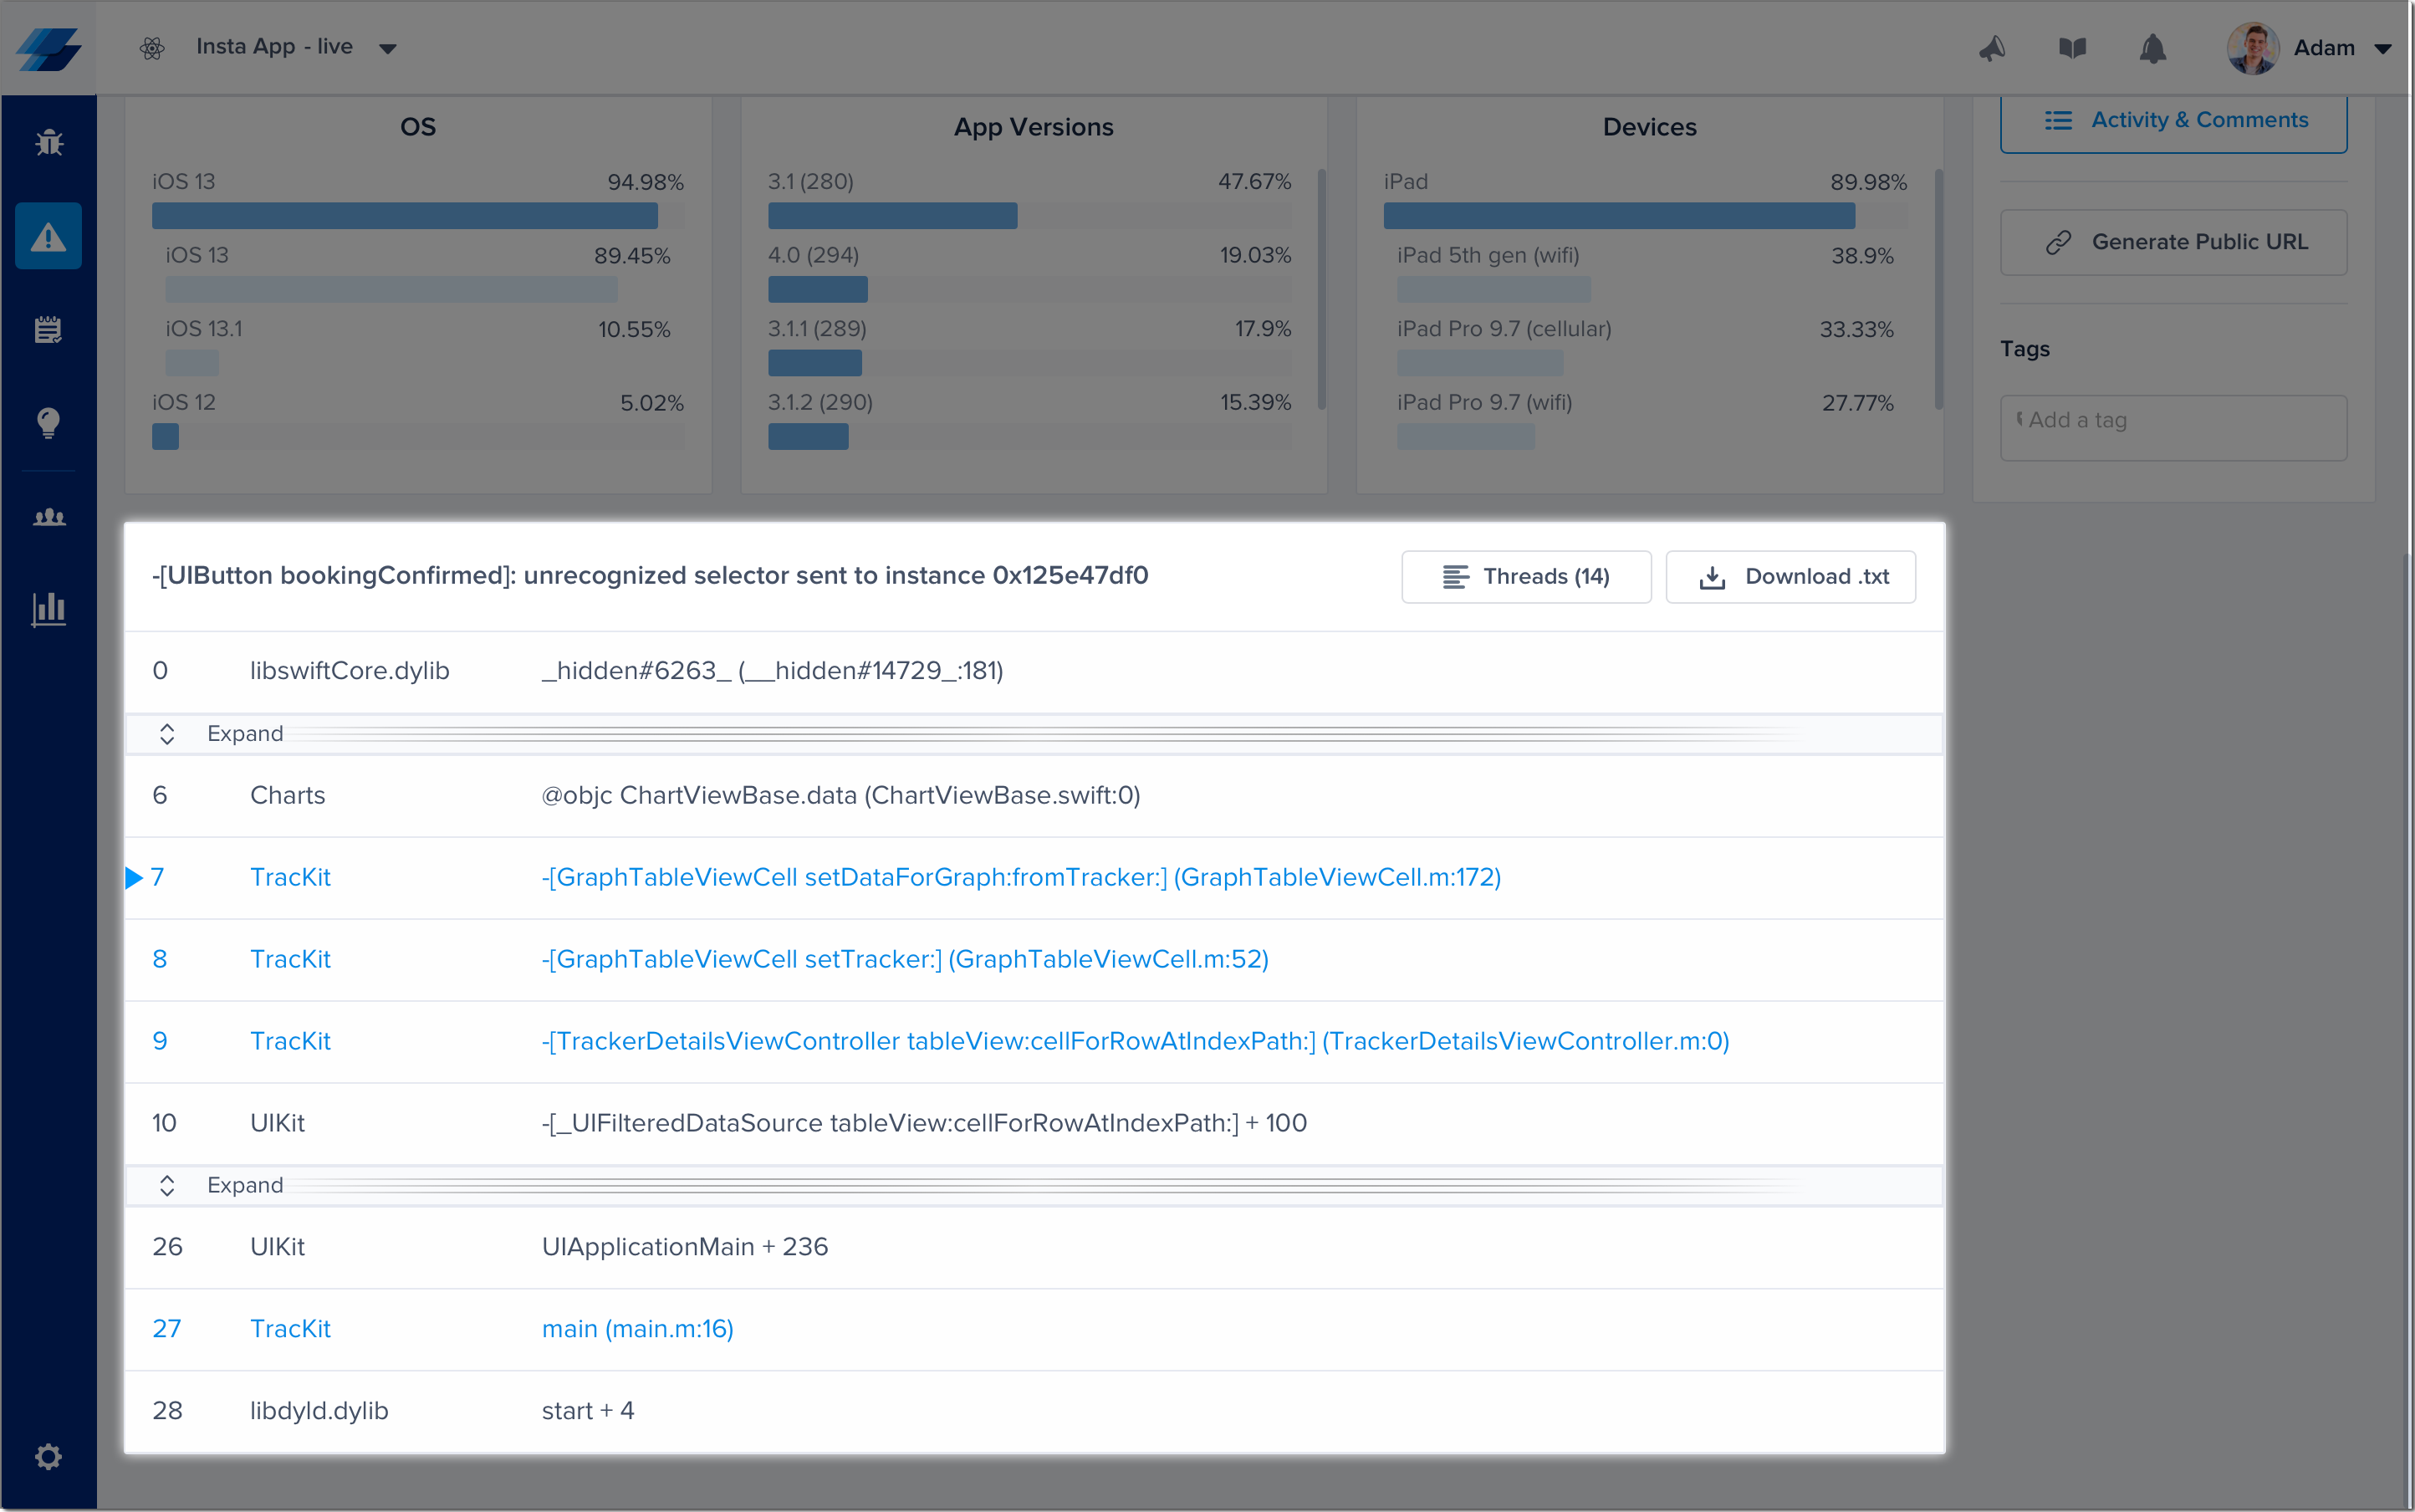
In each crash report, you can find the stack trace of the crash with the most important frames highlighted in blue. These highlighted frames are your application's frames. In order for these crashes to be readable, symbolication/deobfuscation is required. More information on this can be found here.

An example of a stack trace in the Instabug dashboard.
Occurrences
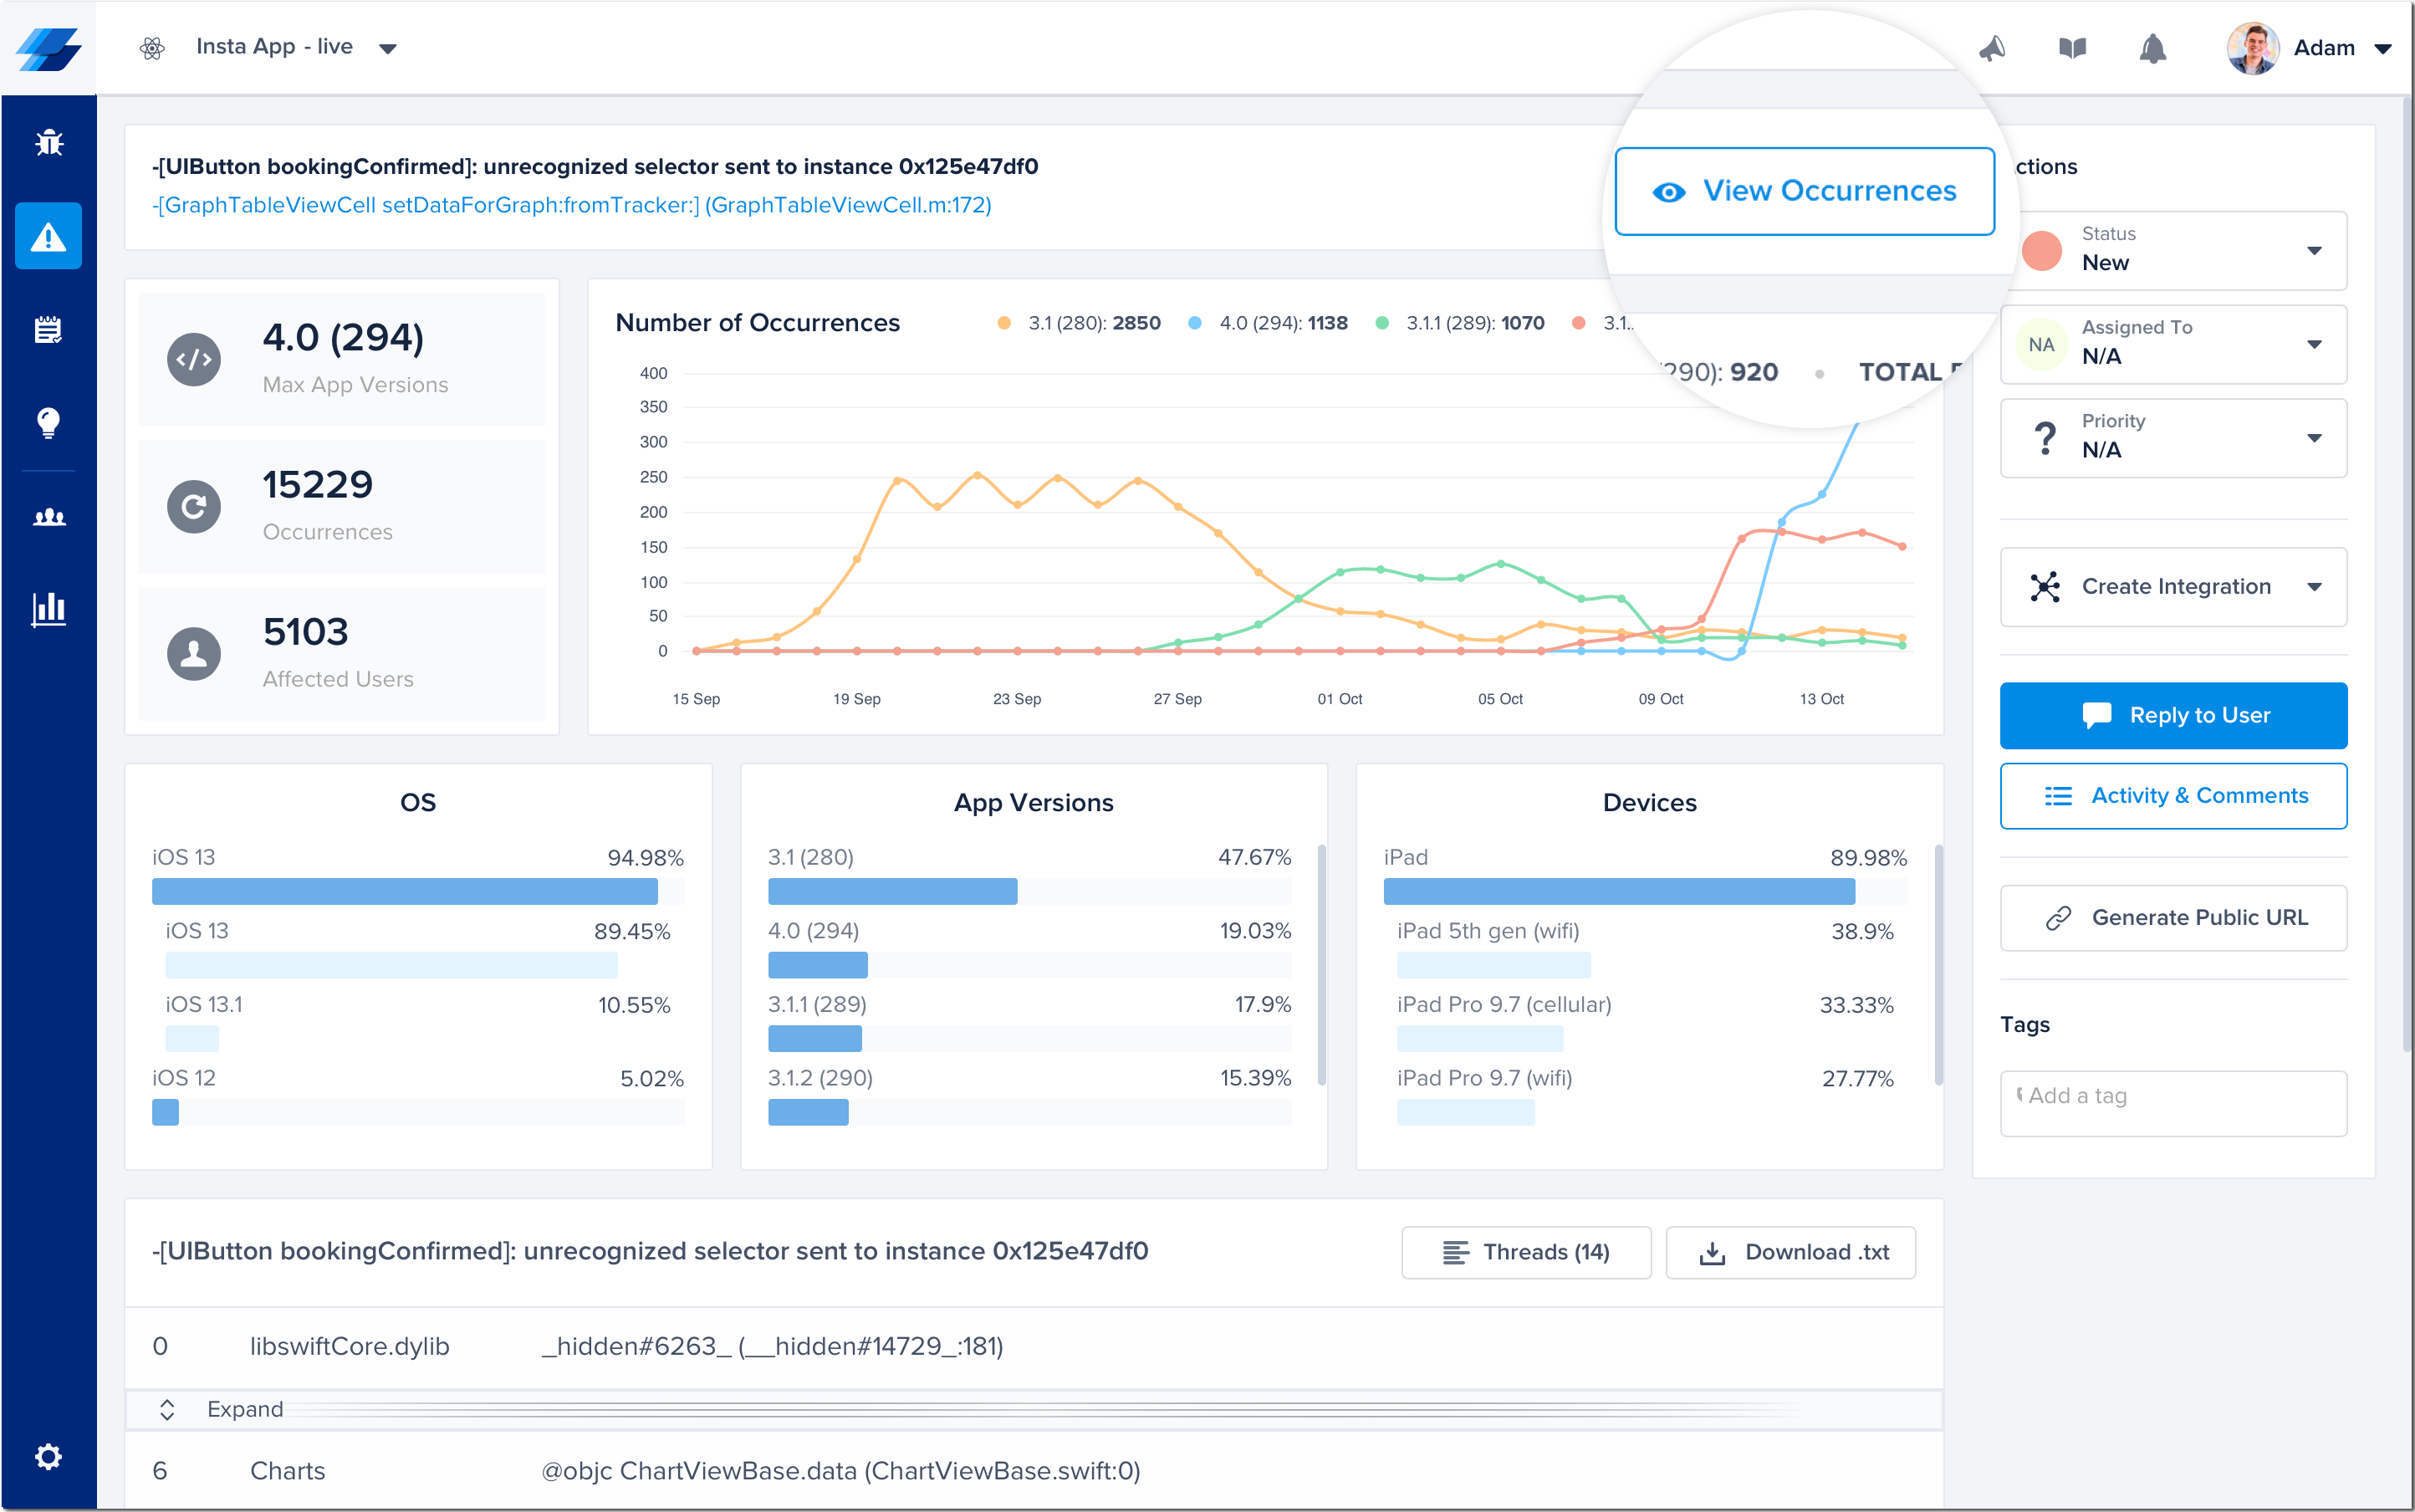
Each crash has occurrences, a unique instance of that crash. With each occurrence, you can find extra details about every instance such as logs, Session Profiler, and User Attributes. You can go through these unique occurrences by clicking on the View Occurrences button.

Click on this button to view details about each occurrence of a crash.
Tags
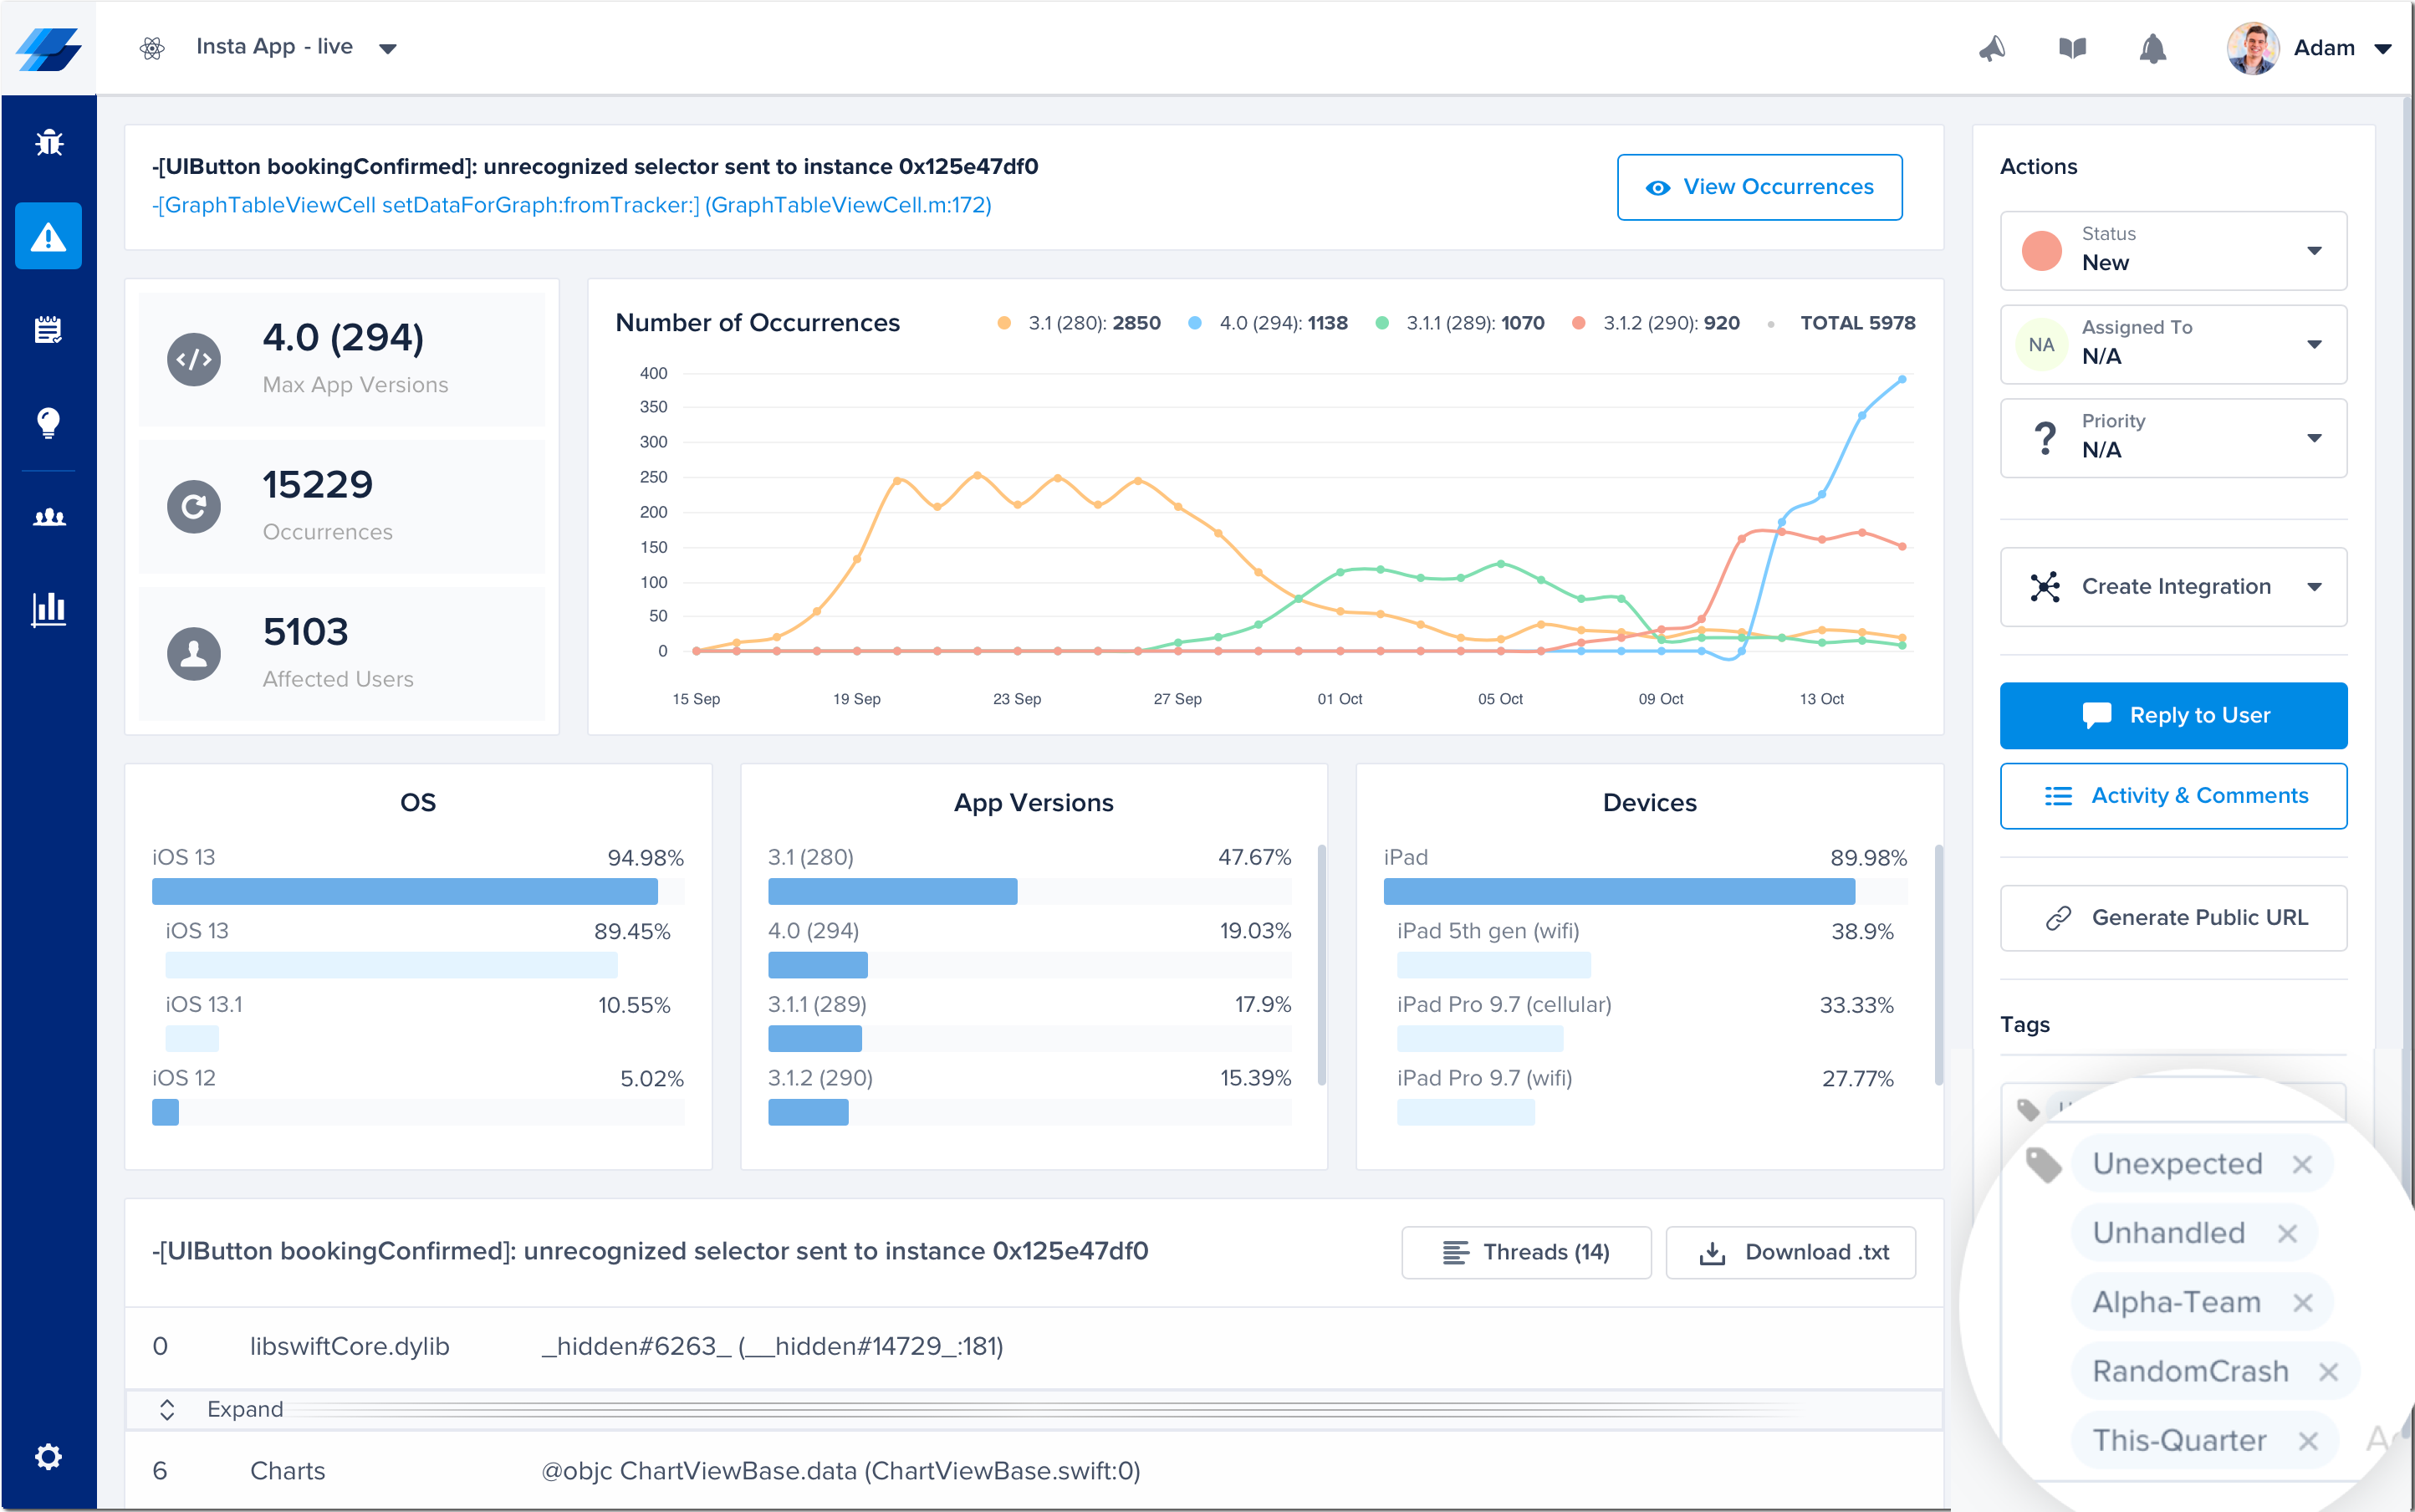
You can add tags to crash reports for filtering and analysis. More details regarding these tags can be found here.

This is where tags appear in your crash reports.
Updated over 5 years ago
Since you're now familiar with the content of a crash report, familiarize yourself with the content of each occurrence as well.
