Reporting Crashes
Covered here are APIs relevant to reporting crashes.
Privacy Policy
It is highly recommended to mention in your privacy policy that you may be collecting logging data in order to assist with troubleshooting crashes.
There are two ways to have your application report a crash, either automatically or manually. After the crash is sent to your dashboard, you can sort and filter for specific crashes easily.
Automatic Crash Reporting
If your plan includes crash reporting, crashes will automatically be reported to and viewable from the crashes page of your Instabug dashboard.
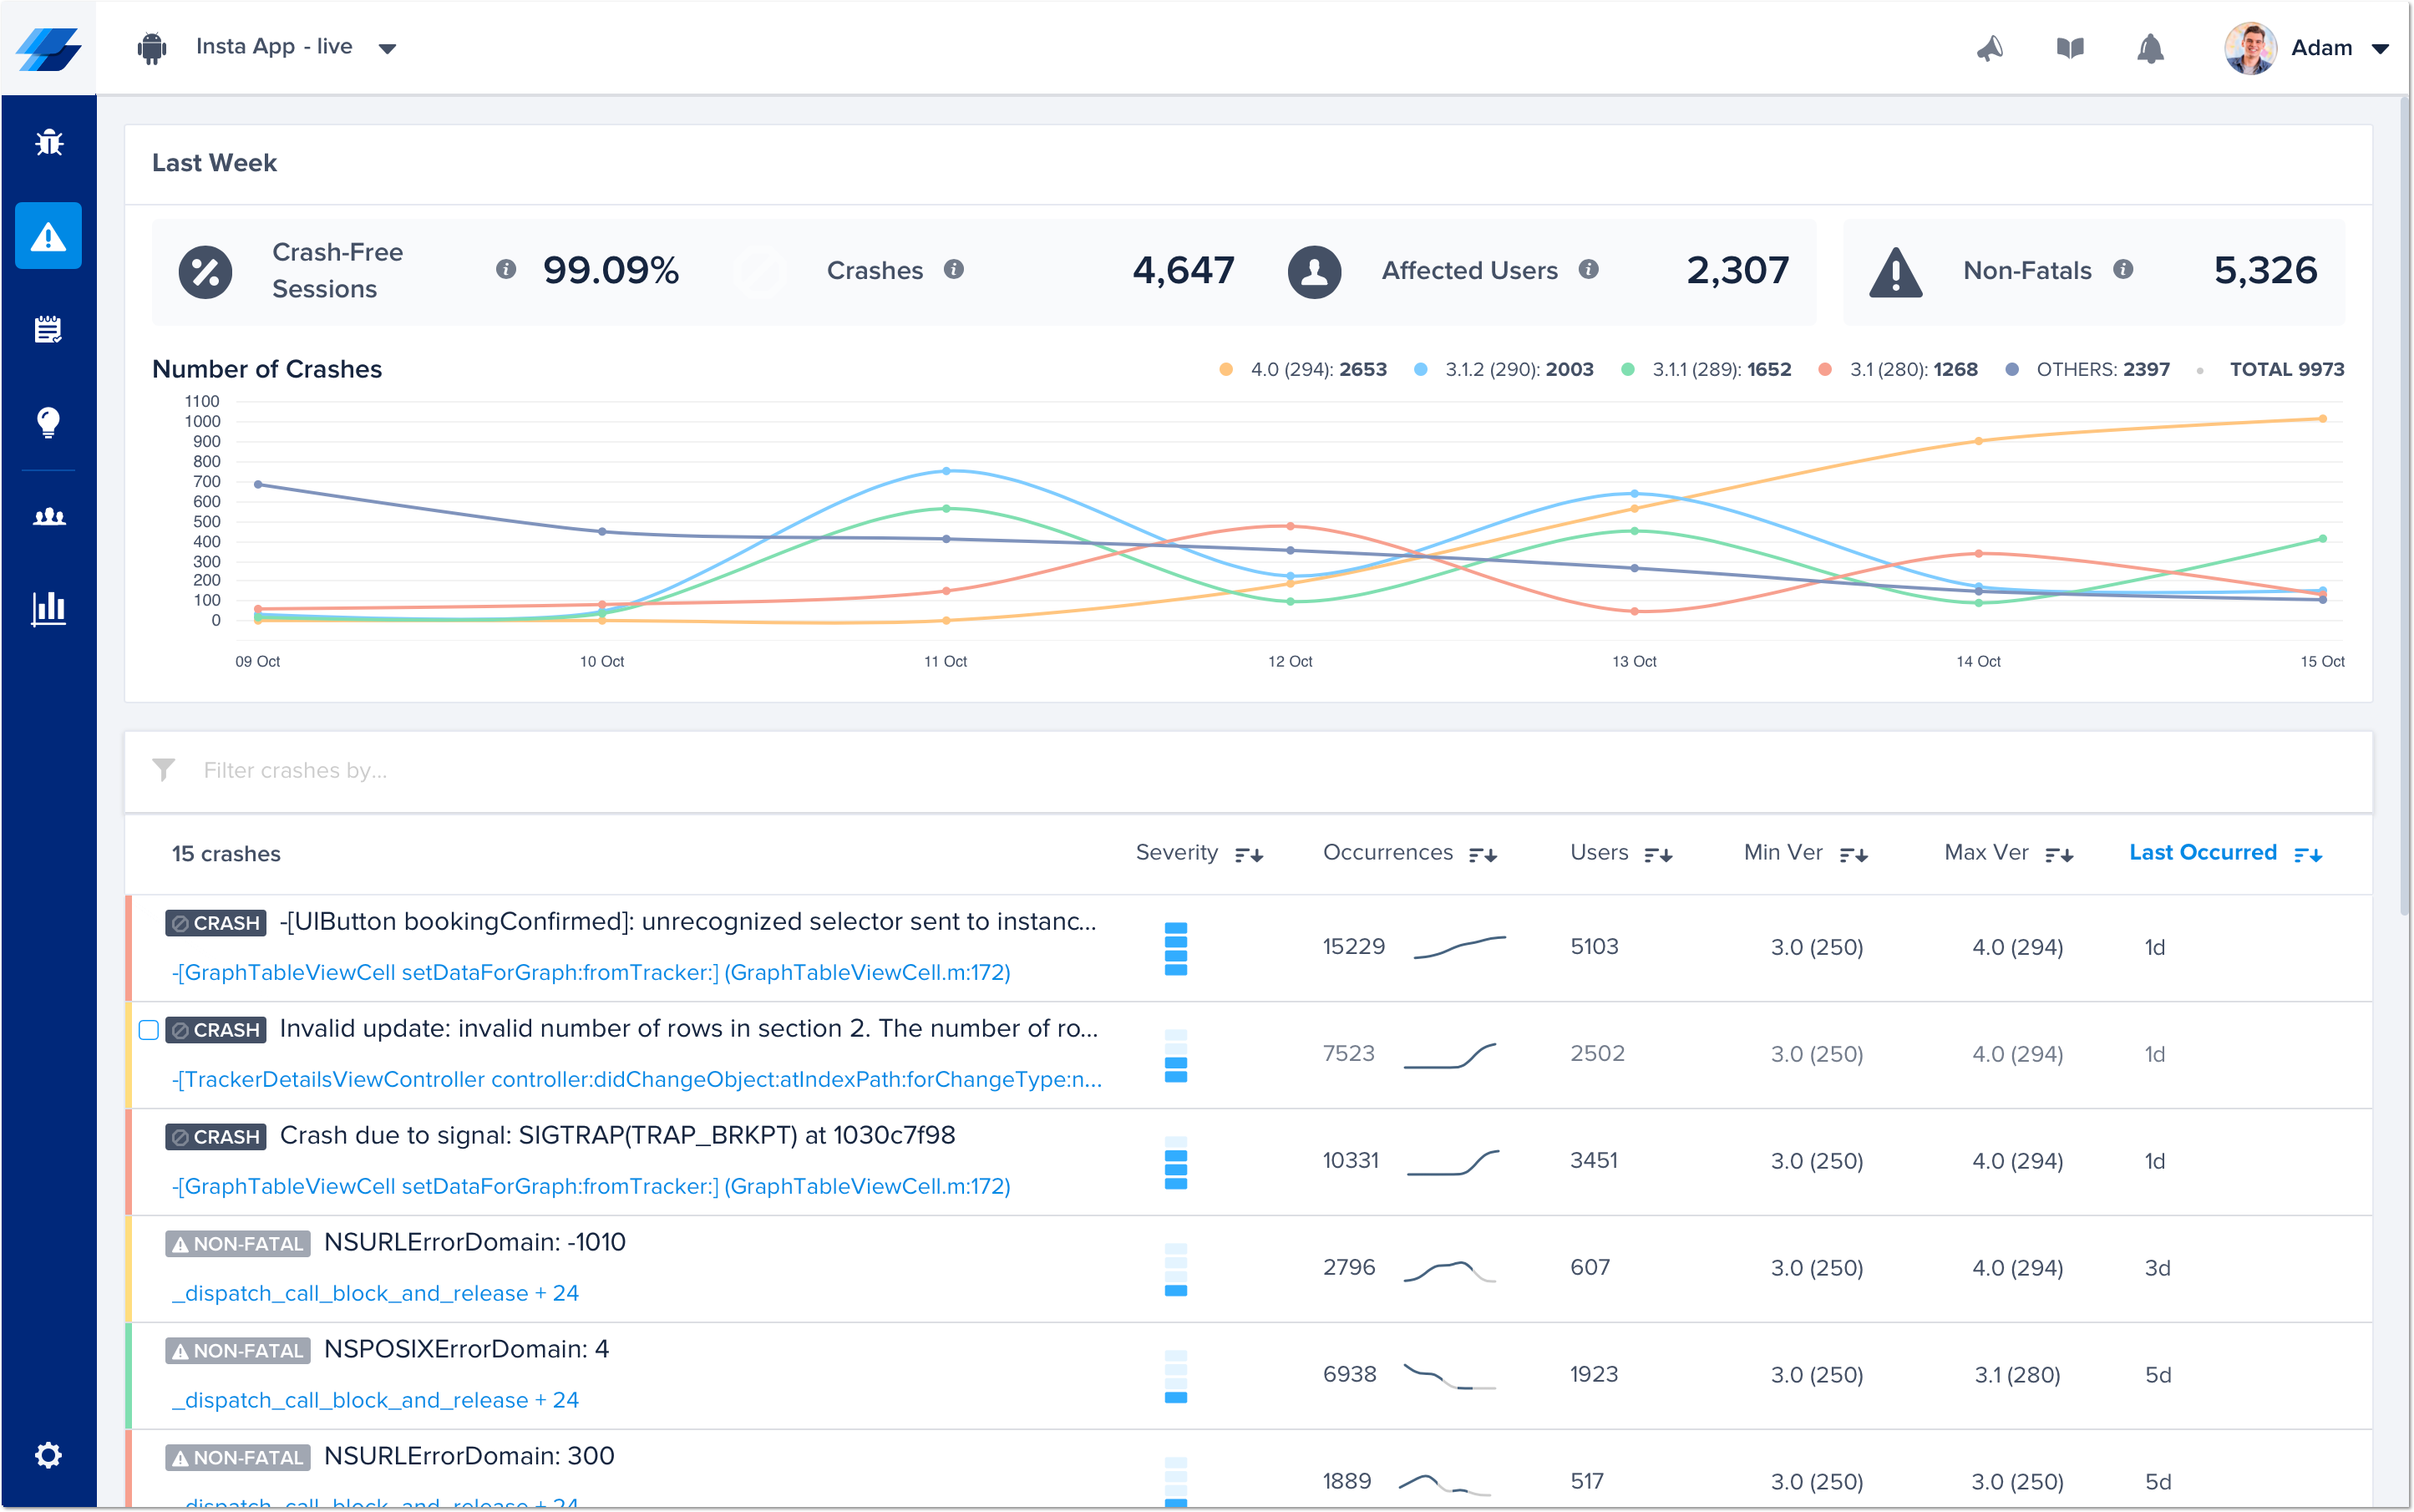
You'll also be able to see the trends covering the previous 7 days for percentage of crash-free sessions (sessions that ran and concluded without any fatal errors), total number of crashes, total number of unique affected users, and total number of non-fatal errors. An email will be sent to you if there is sharp decline in the crash-free sessions percentage.

This is the crashes page of the Instabug dashboard.
ANR Crashes
By default, if Crash Reporting is enabled, Instabug captures any ANR that occurs within your app, along with the stack trace of the crash.
You can disable/enable ANR reporting using the following API:
CrashReporting.setAnrState(Feature.State.DISABLED);
CrashReporting.setANRState(Feature.State.DISABLED)
Manual Crash Reporting
You can manually report your own exceptions or errors in case you already handle them in your code.
Report Exception
To report exceptions manually, use the following method. Both errors and exceptions can be passed to this method.
CrashReporting.reportException(new NullPointerException("Test issue"));
CrashReporting.reportException(NullPointerException("Test issue"))
Here is another example.
CrashReporting.reportException(new NullPointerException("Test issue"), "Exception identifier");
CrashReporting.reportException(NullPointerException("Test issue"), "Exception identifier")
Crashes List
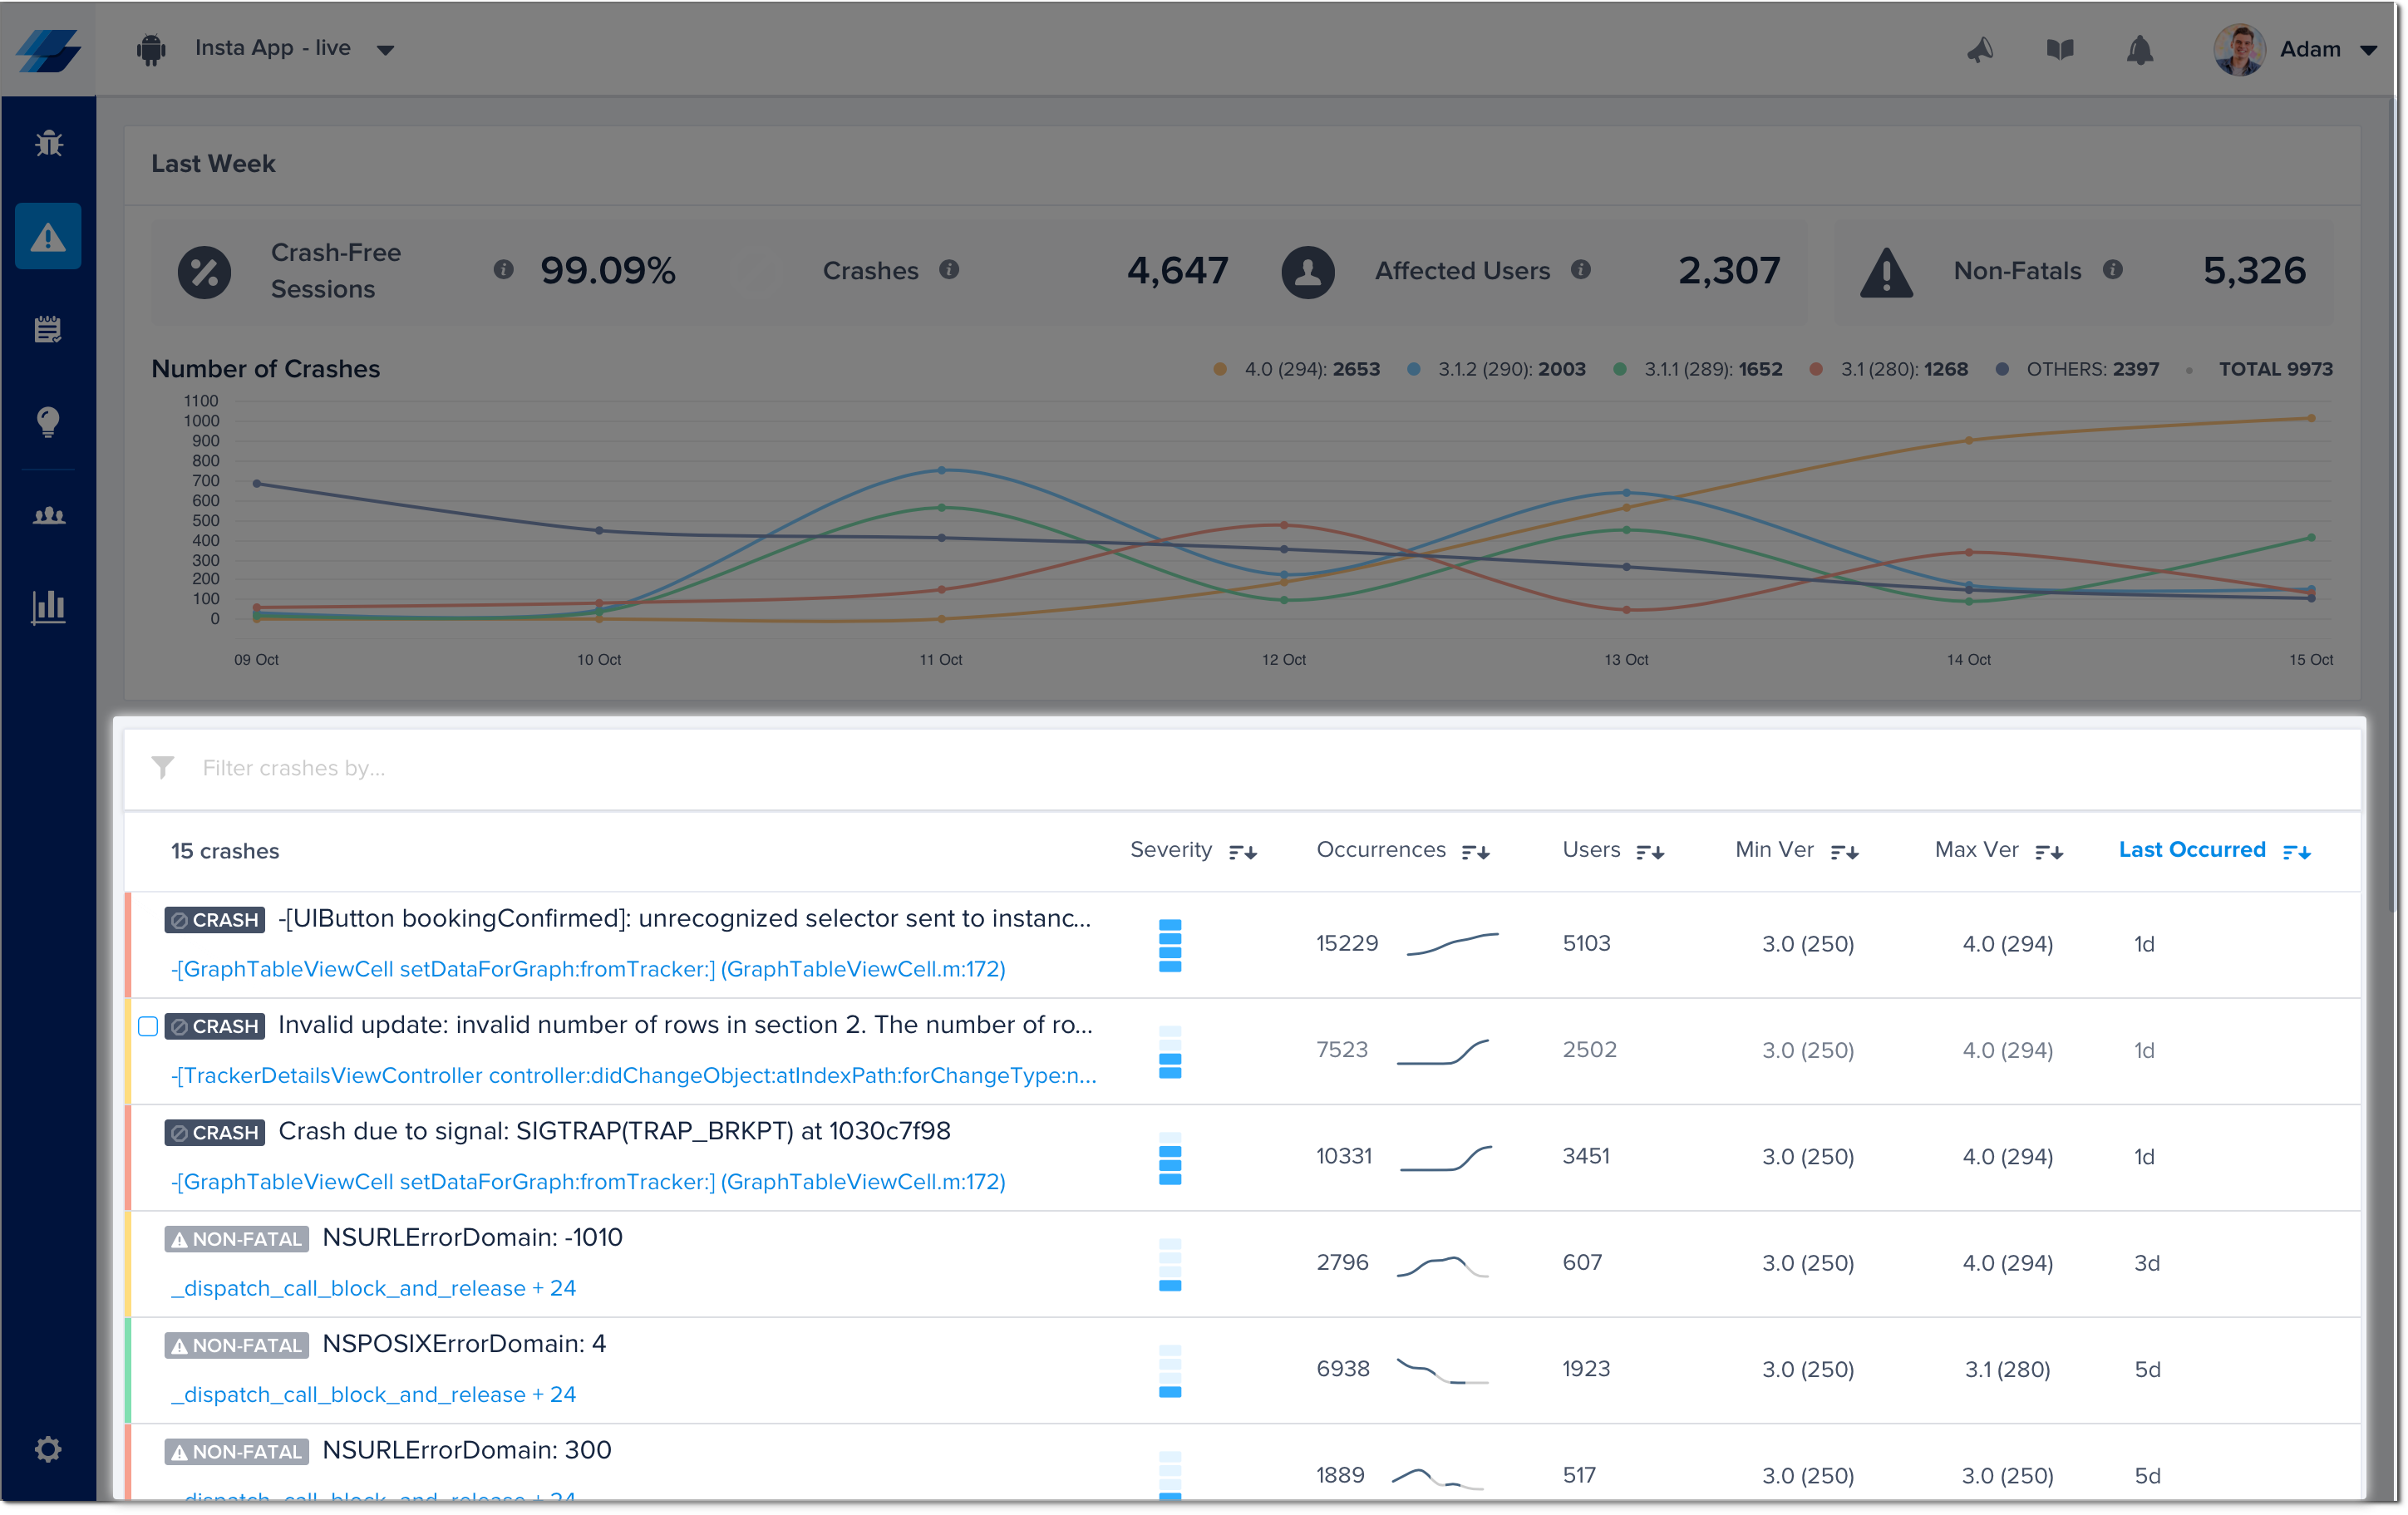
This section contains a list of all the crashes that have been reported by your application. The title of each crash is usually the most significant line in the stack trace.

An example of the list of crashes in the crashes page of the Instabug dashboard.
Next to each crash in the list, you can find the following details, all of which can be used to sort the crashes:
- Severity: Blue dashes that show the seriousness of this crash from low (one dash), moderate (two dashes), high (three dashes), and critical (four dashes) by taking into consideration several factors, including the percentage of affected users, the number of crashed sessions, and app versions impacted by that crash. When a crash has high severity, an email notification will be sent to your email regarding the crash in question since these crashes have the highest impact on your users.
- Occurrences: The number of times this crash has occurred.
- Users: The number of users affected by this crash.
- Min Version: The lowest app version number affected by this crash.
- Max Version: The highest app version number affected by this crash.
- Last Occurred: When the latest occurrence of this crash happened.
You can then filter for crashes that match any of the following criteria:
- Status
- Assignee
- Priority
- Severity
- App Version
- OS
- Type
- Integrations
- User Attributes
Updated almost 5 years ago
Learn more about the content contained in crash reports as well as how to deobfuscate them. You can also use callbacks to collect additional information.
