Network
This page helps you get started with Instabug's network performance monitoring on iOS, understand apdex calculation, and customize URLs grouping.
Getting Started
Instabug automatically captures your HTTP/S network requests when you are using the default session configuration. If some of your requests don't appear, you can follow the instructions below, depending on your setup: Custom Session Configuration, AFNetworking, or Alamofire.
Using Custom Session Configuration?
If you're using a custom NSURLSession or NSURLSessionConfiguration, add the following code snippet.
let configuration = URLSessionConfiguration.ephemeral
NetworkLogger.enableLogging(for: configuration)
let session = URLSession(configuration: configuration)
NSURLSessionConfiguration *configuration = NSURLSessionConfiguration.ephemeralSessionConfiguration;
[IBGNetworkLogger enableLoggingForURLSessionConfiguration:configuration];
NSURLSession *session = [NSURLSession sessionWithConfiguration:configuration];
Using AFNetworking?
To enable network monitoring for AFNetworking, create the following class. Then use IBGAFURLSessionManager to create your requests.
// IBGAFURLSessionManager.h

#import <AFNetworking/AFNetworking.h>

@interface IBGAFURLSessionManager : AFURLSessionManager

@end

// IBGAFURLSessionManager.m

#import "IBGAFURLSessionManager.h"
#import <Instabug/Instabug.h>

@implementation IBGAFURLSessionManager

- (instancetype)initWithSessionConfiguration:(nullable NSURLSessionConfiguration *)configuration {
		[IBGNetworkLogger enableLoggingForURLSessionConfiguration:configuration];

    return [super initWithSessionConfiguration:configuration];
}

@end
Using Alamofire?
To enable logging for Alamofire, create the following class. Then use IBGSessionManager to create your requests.
import Alamofire
import Instabug

class IBGSessionManager: Alamofire.Session {
    static let sharedManager: IBGSessionManager = {
        let configuration = URLSessionConfiguration.default
        NetworkLogger.enableLogging(for: configuration)
        let manager = IBGSessionManager(configuration: configuration)
        return manager
    }()
}
URL Patterns
URL patterns are used to group the relevant network call occurrences and aggregate their numbers. Let's take the following examples:
sample.com/list/3/item/1sample.com/list/3/item/2sample.com/profile/
It looks like 1 and 2 are the same request, but asking for different resources. While 3 is an entirely different one. Those three examples result in the following 2 URL patterns:
sample.com/list/*/item/*sample.com/profile/
What Are the URL Pattern Components?
- Plain text: works with exact string matching
*: matches with any URL part.*matches with only one part at a time. For example if you are mappingsample.com/part/variable1/variable2, your pattern should besample.com/part/*/*and notsample.com/part/*
Does Instabug Detect Patterns Automatically?
Instabug automatically detects numbers and hexadecimal tokens in your URLs and replaces them with *.
Can You Create Custom Patterns?
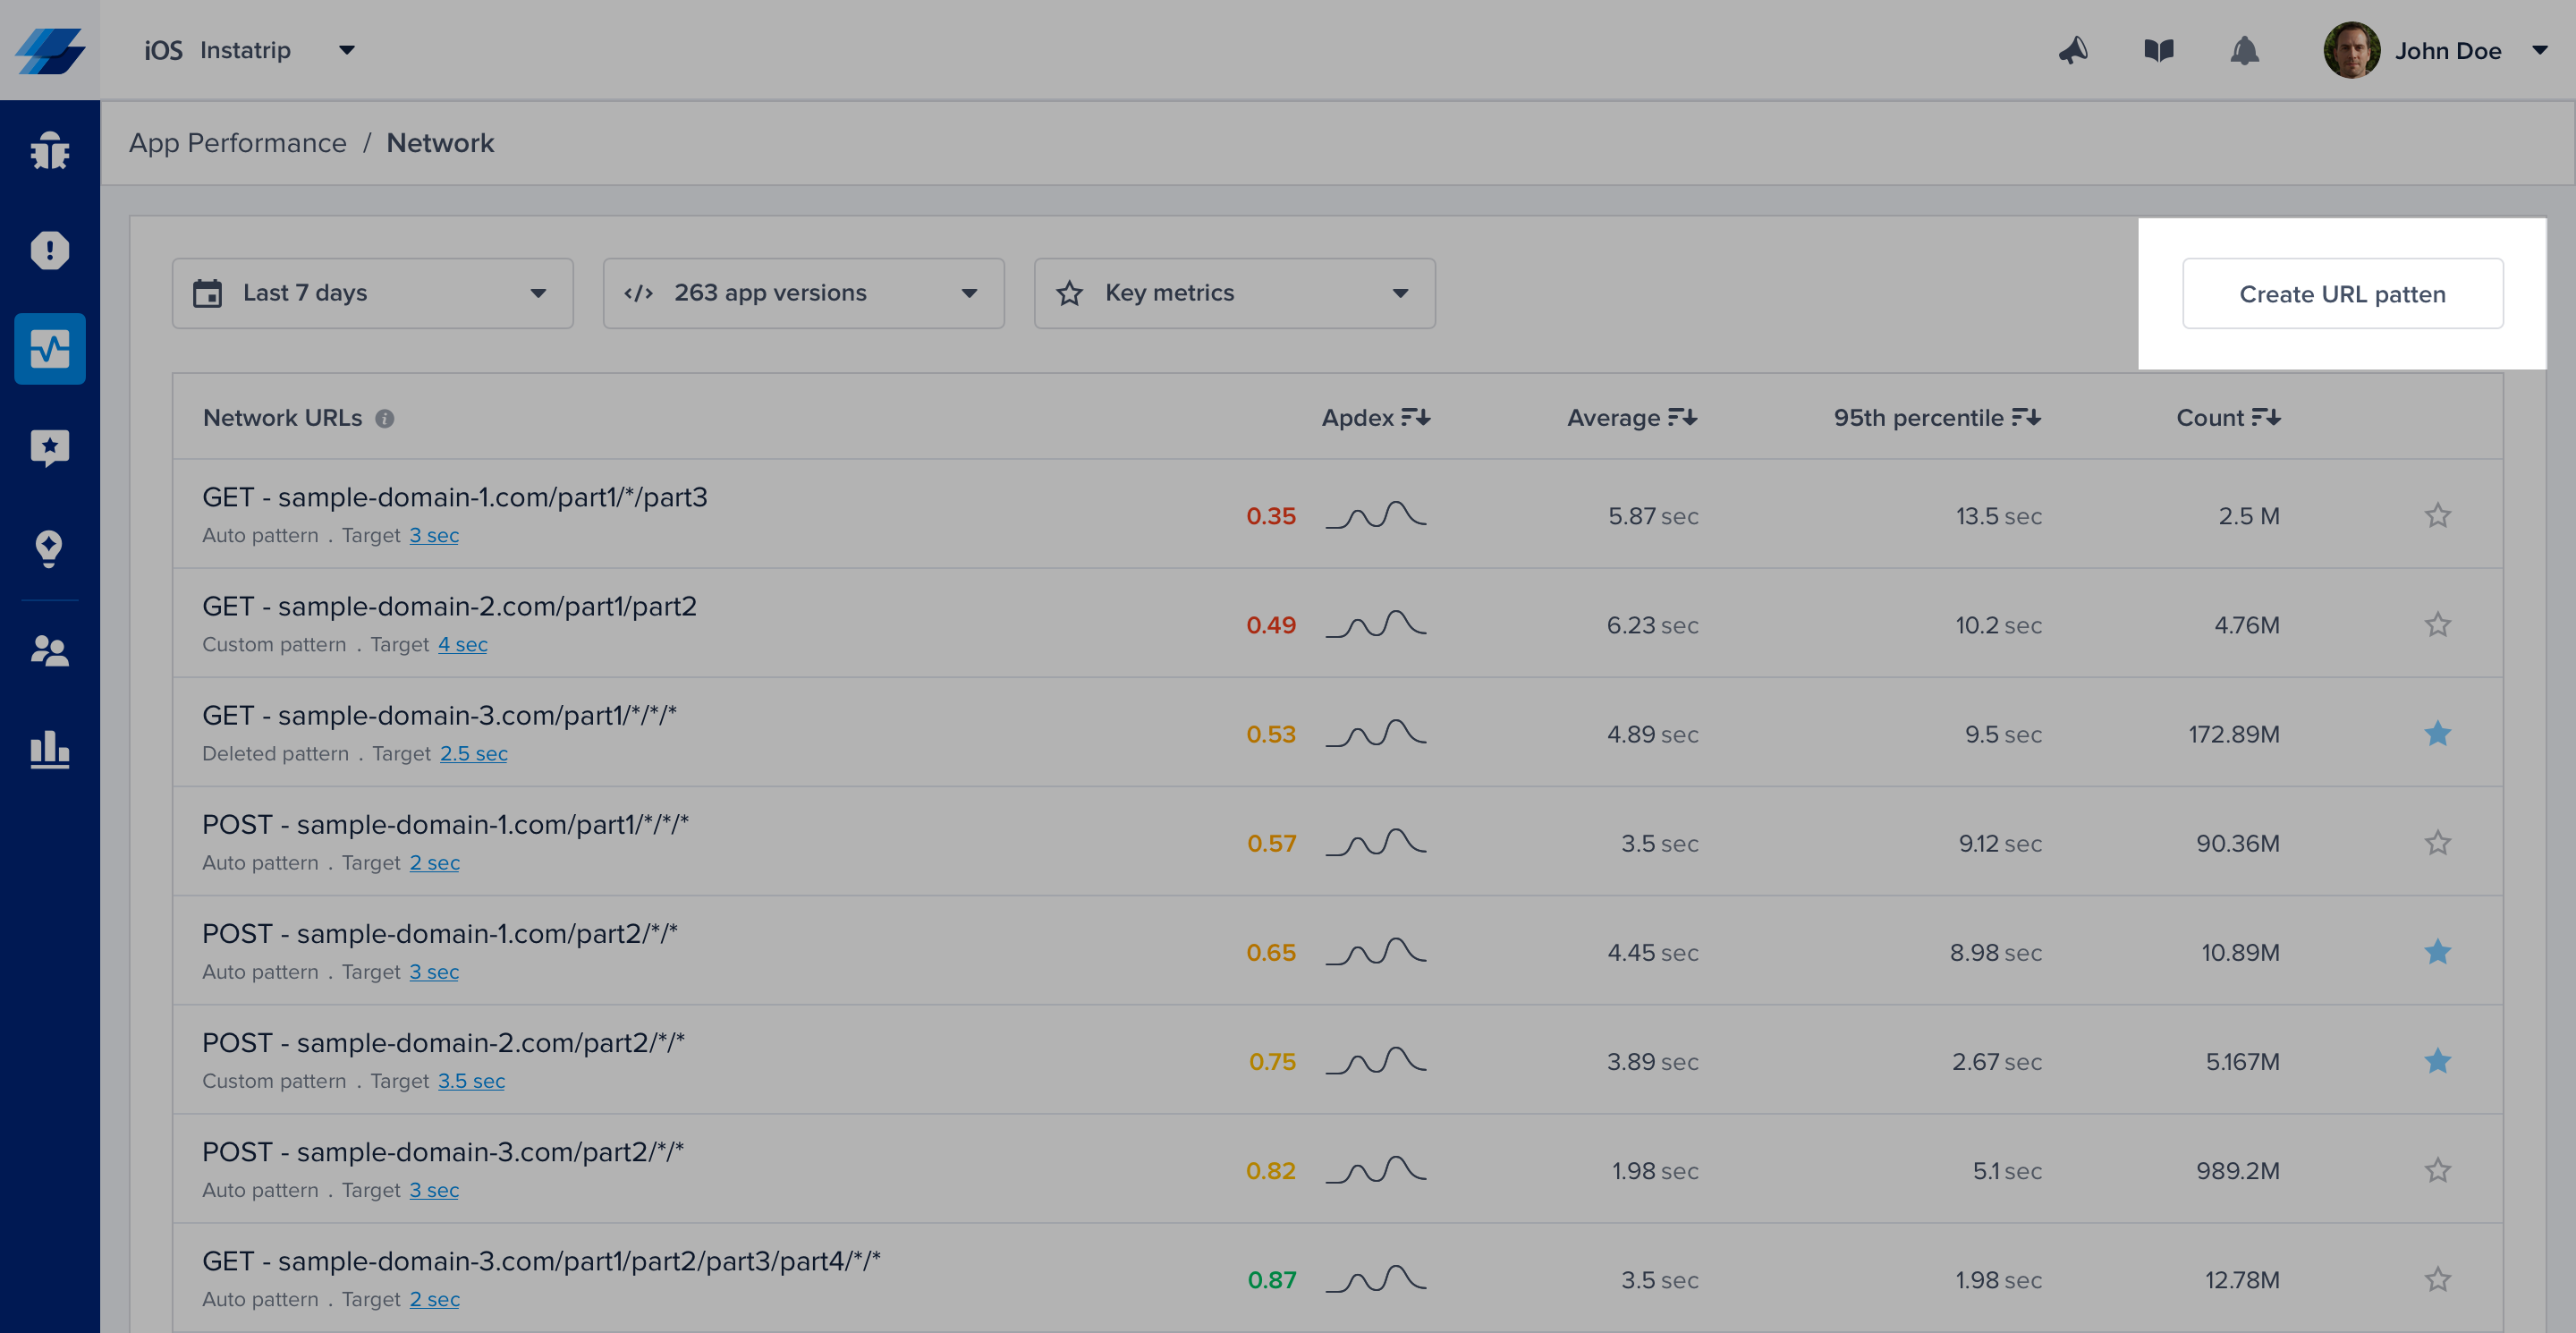
If you are using more complex URLs where variable parts may contain plain text and not only numbers and hexadecimal, we recommend defining your custom patterns. Just click on the "Create URL pattern" button in your network list.

Click on the highlighted action to create new URL patterns. URL patterns are used to group relevant network calls.
Here are a few examples:
| URL pattern example | Matches with | Doesn't match with |
|---|---|---|
sample.com/part1/part2 | sample.com/part1/part2 | sample.com/part1 |
sample.com/part1/* | sample.com/part1/part2 | sample.com/part1/part2/part3 |
sample.com/part1/*/part3 | sample.com/part1/part2/part3 | sample.com/part1/part3/part4sample.com/part1/part2/part3/part4 |
sample.com/part1/*/*/part4 | sample.com/part1/part2/part3/part4 | sample.com/part1/part2/part4sample.com/part1/part2/part3/part4/part5 |
sample.com/part1/*/*/* | sample.com/part1/part2/part3/part4 | sample.com/part1/part2/part3/part4/part5sample.com/part1/part2/part3 |
Some notes to consider while creating your URL patterns:
- Custom URL patterns that you define have higher precedence than the auto-generated ones. If the same call matches with a custom and an auto pattern, it gets grouped with the custom.
- At any point, you can delete a pattern to prevent grouping new calls with it.
- URL patterns shouldn't overlap. Each incoming network call gets grouped with only one pattern. In case of conflict, it gets merged with the newest pattern.
Creating or deleting patterns doesn’t affect your old data that has already been grouped. It only affects the upcoming network requests.
Network Calls Apdex
Instabug calculates an Apdex score for every network request (URL pattern) in your app. Apdex score ranges between 0 and 1. The higher the value, the closer you are to satisfying user experience:
- Apdex score ≥ 0.94 equates to Excellent performance.
- Apdex score ≥ 0.85 and < 0.94 equates to Good performance.
- Apdex score ≥ 0.7 and < 0.85 equates to Fair performance.
- Apdex score ≥ 0.5 and < 0.7 equates to Poor performance.
- Apdex score < 0.5 is considered Unacceptable.
How Is the Network Calls Apdex Calculated?
When a network call occurrence is collected, it is flagged based on a pre-defined target (T). A network call occurrence is considered:
- Satisfying: if its duration ≤ T
- Tolerable: if its duration < T and ≤ 4T
- Frustrating: if its duration > 4T or if it fails due to a server-side or client-side error.
Then based on the bucketing explained above, the Apdex is calculated:
Total occurrences = Satisfying occurrences + Tolerable occurrences + Frustrating occurrencesApdex score = (Satisfying occurrences + 0.5 * Tolerable occurrences) / Total occurrences
How Can You Control a Specific Network Call's Target?
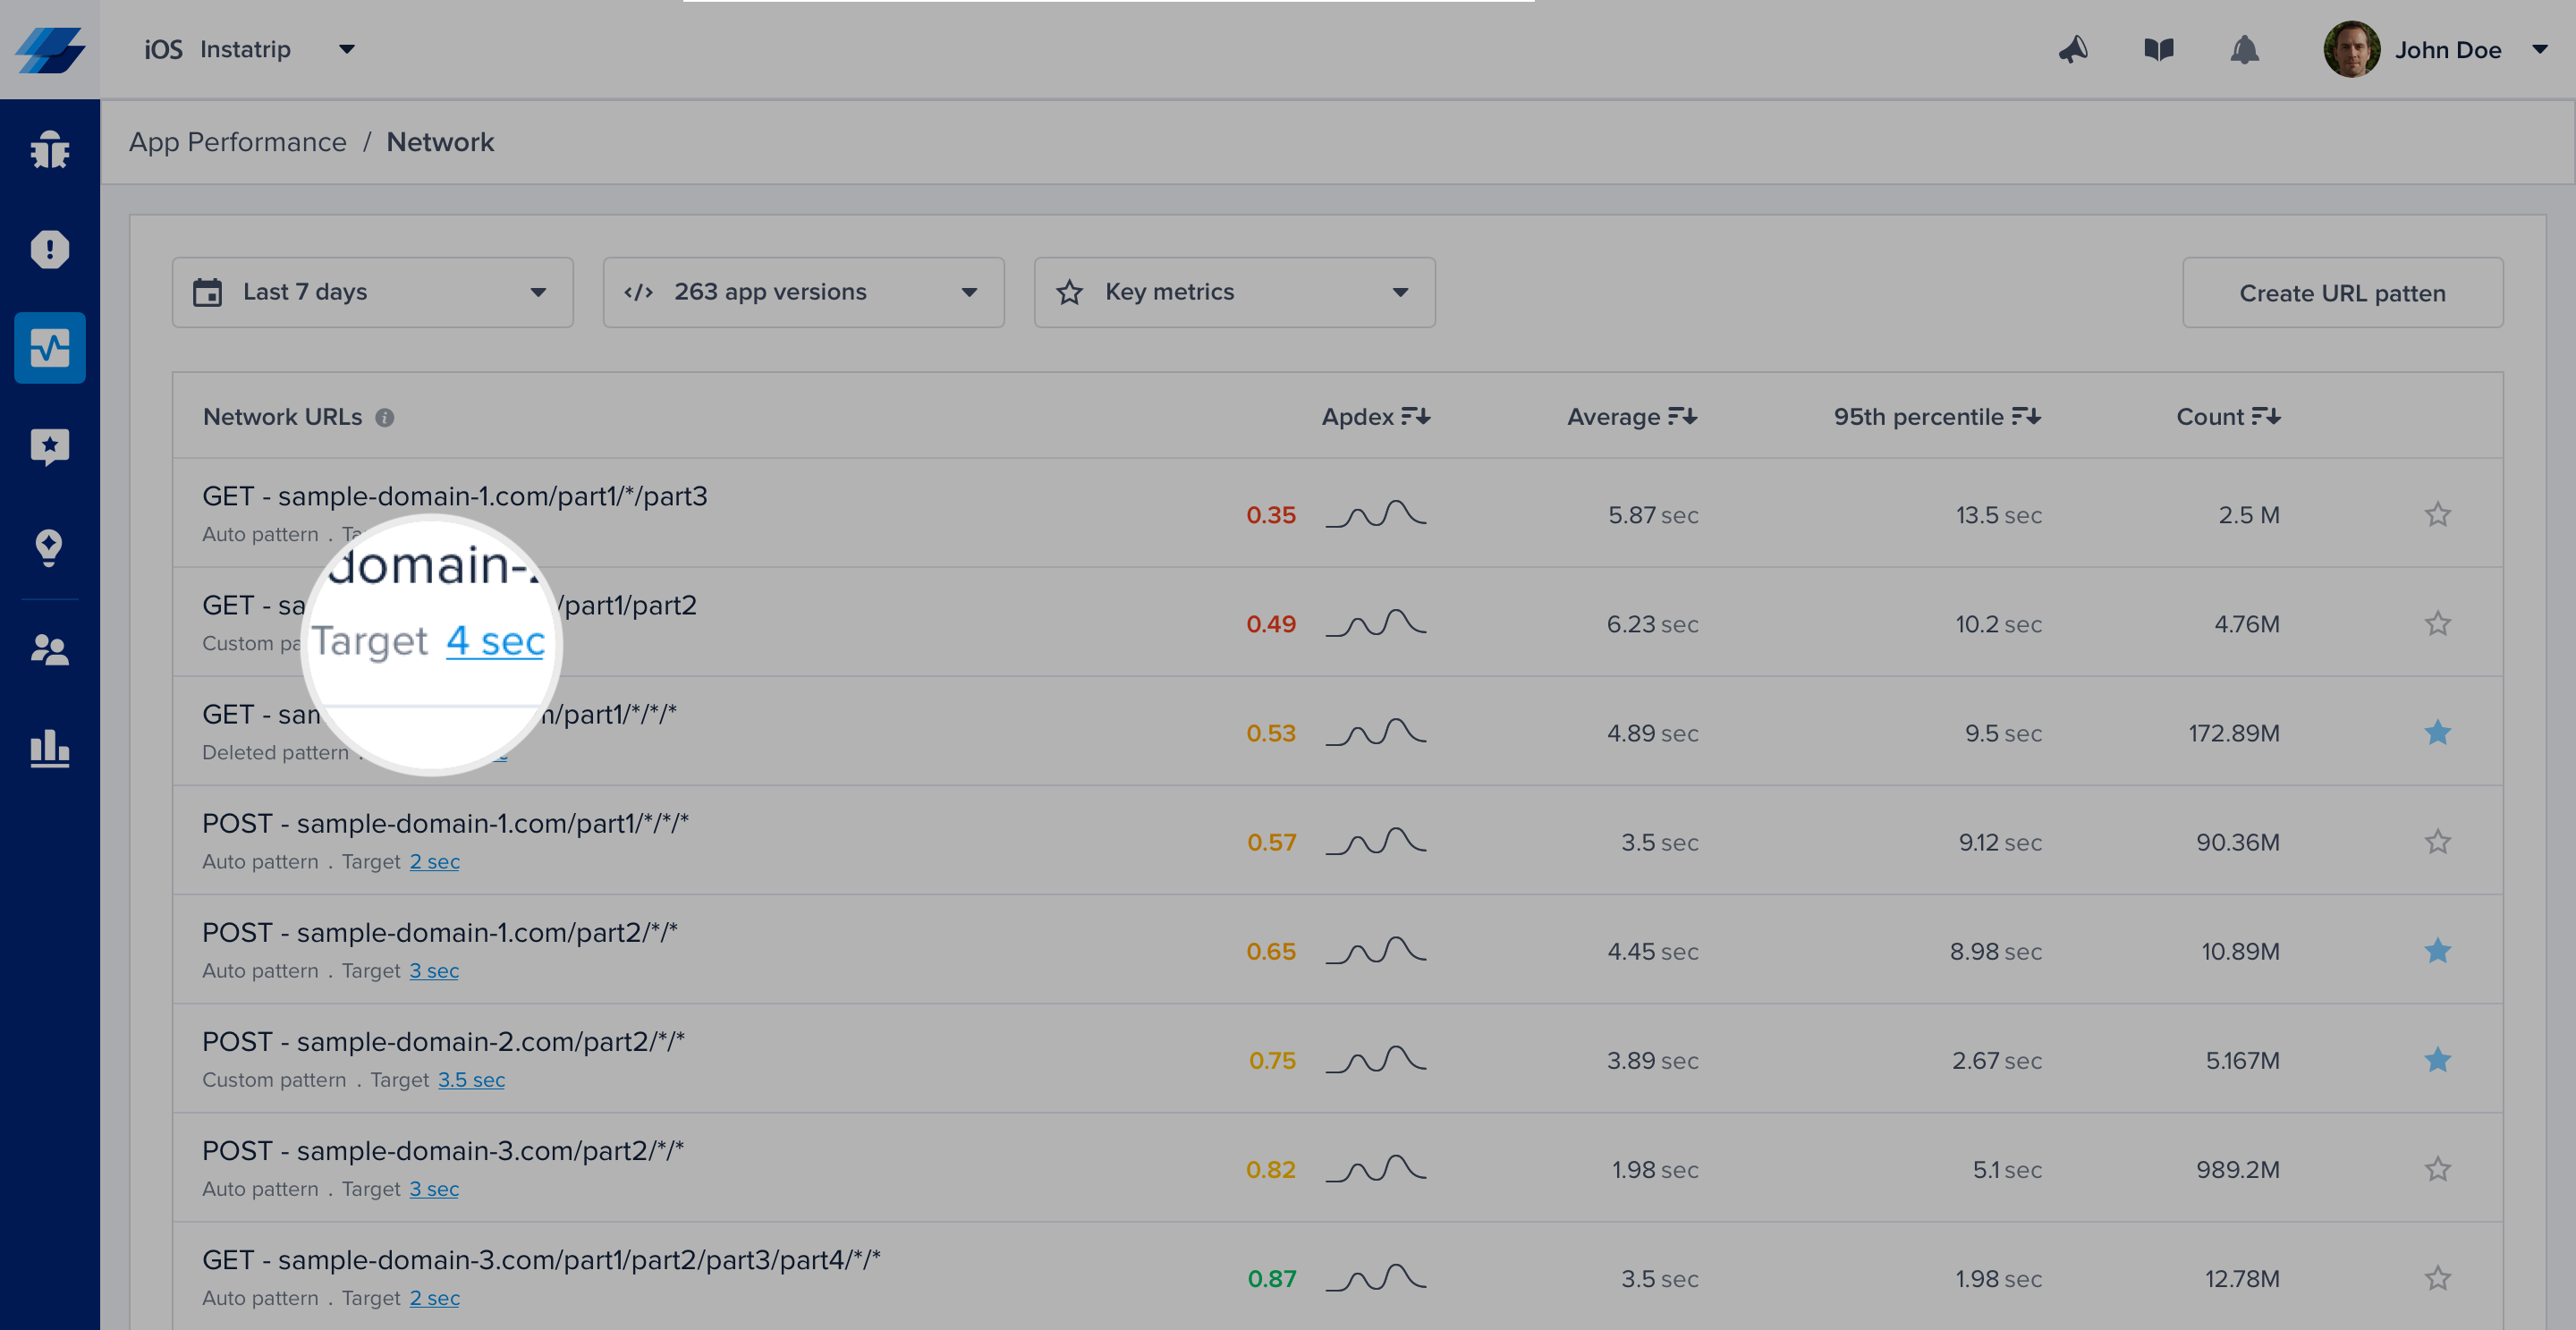
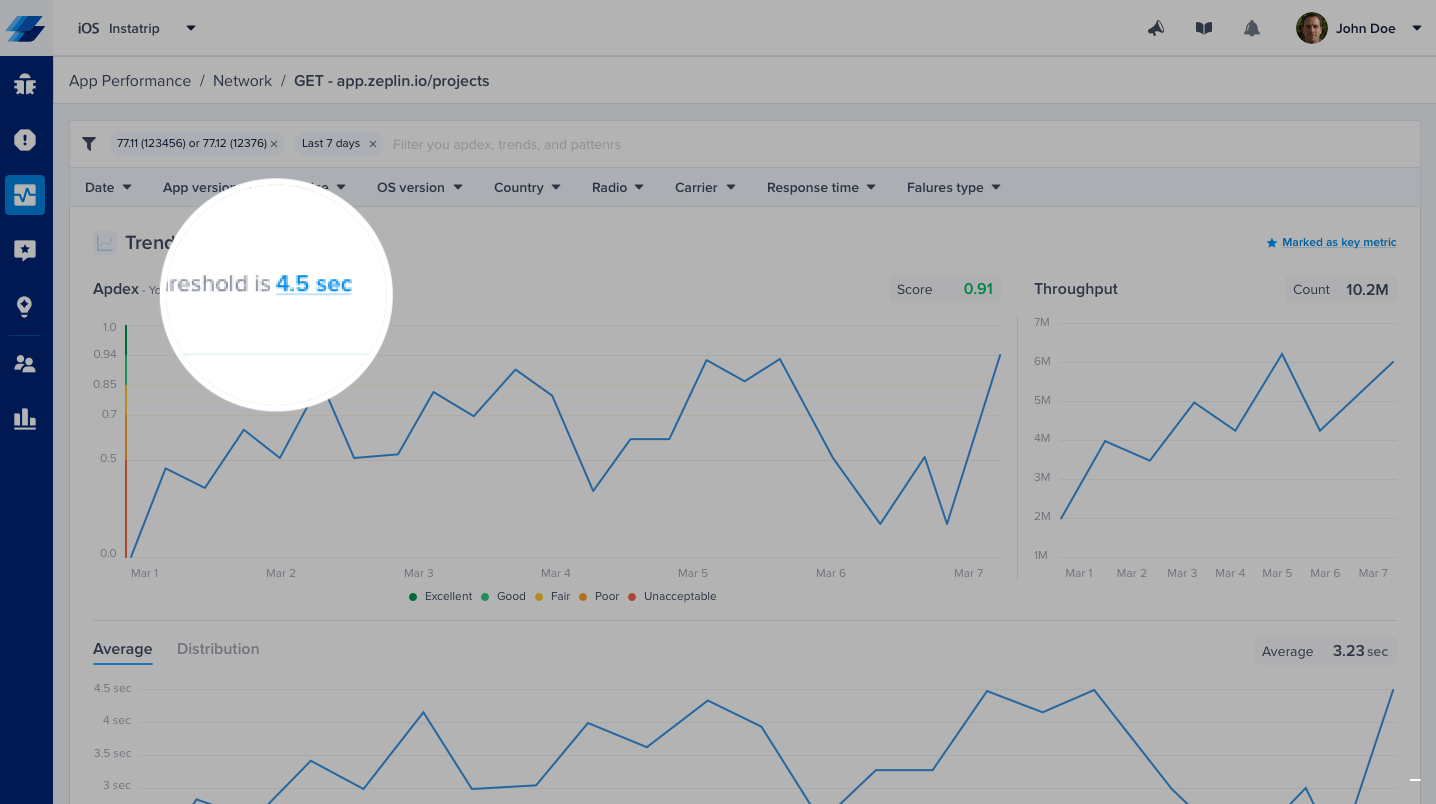
By default, it is set to 2 seconds. However, you can easily change this number from your dashboard by clicking on the action highlighted in the screenshots below.

Click on the target CTA in the list to change the definition of satisfying response time.

Or, you can control it from the corresponding details page.
Please note that updating your response time target does not affect the already stored occurrences, only future occurrences will be flagged using the new target.
Disabling/Enabling Network Performance Monitoring
When APM is enabled in your account, network monitoring works out of the box. If needed, you can disable it by calling the following API after initializing the SDK.
NetworkLogger.enabled = false
IBGNetworkLogger.enabled = NO;
Please note that disabling
NetworkLoggerwill disable Network Logs in Bug Reporting and Crash Reporting as well.
Updated over 4 years ago
