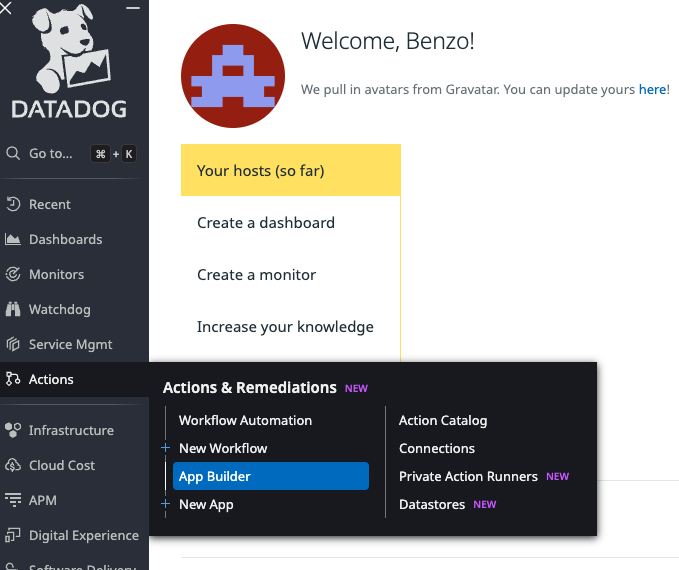
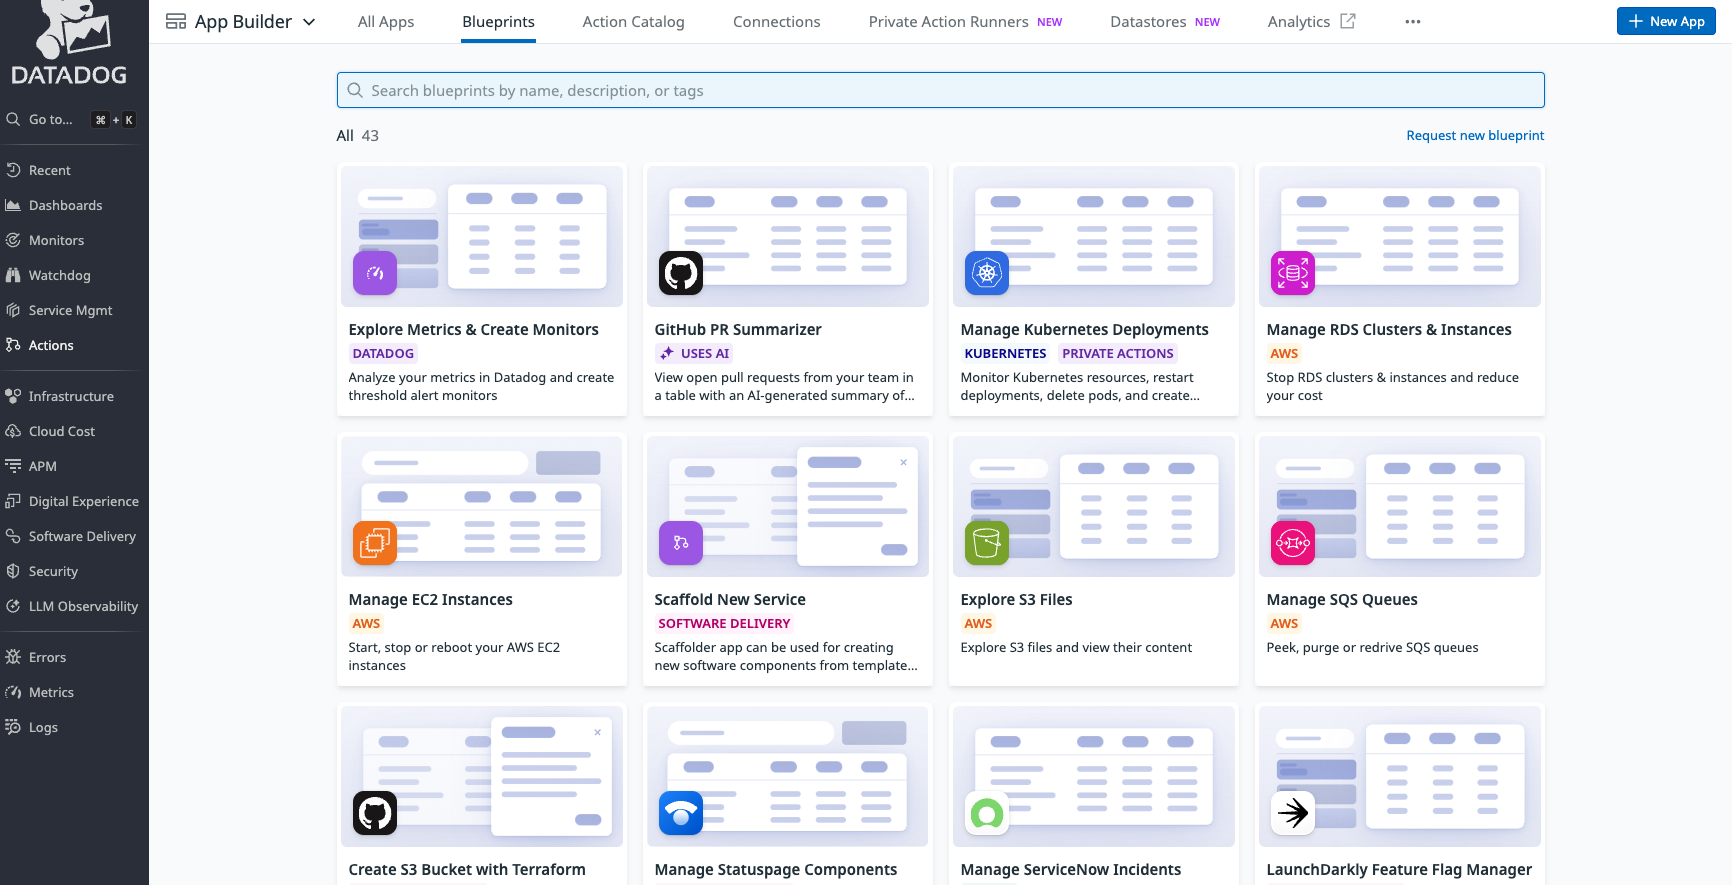
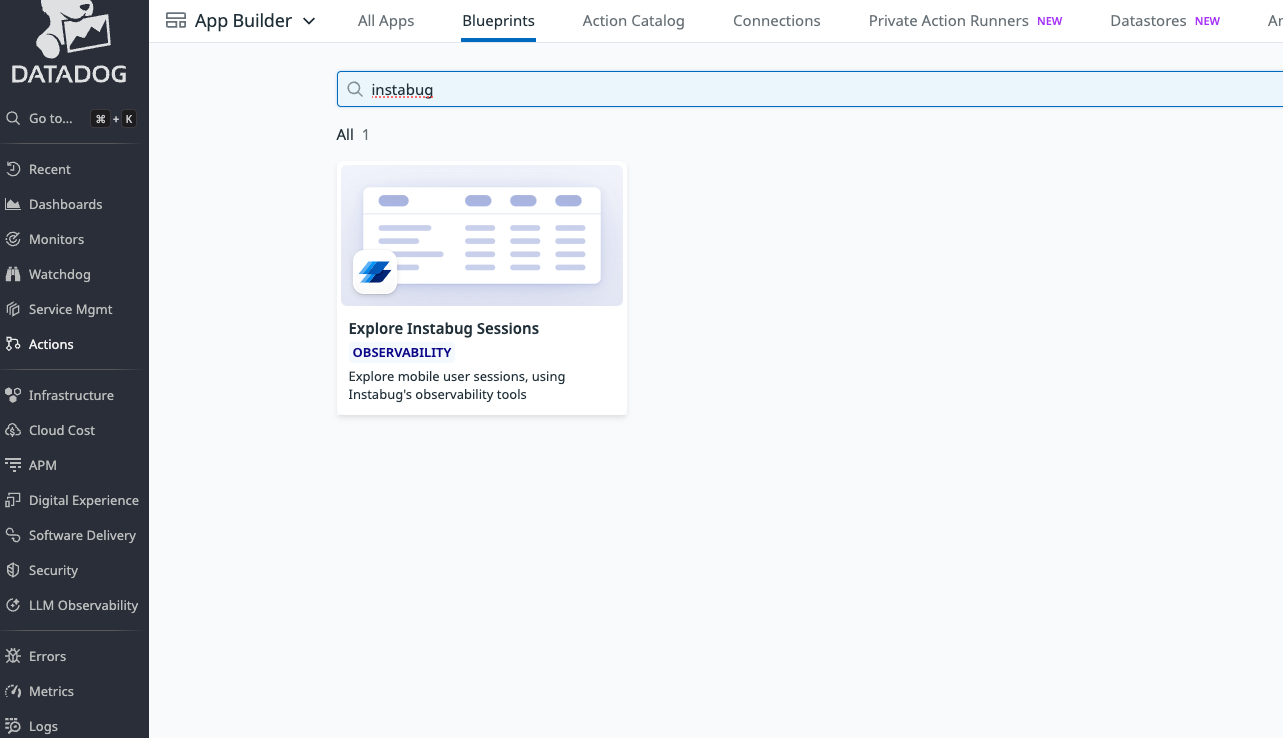
Instabug's widget on Datadog's dashboard

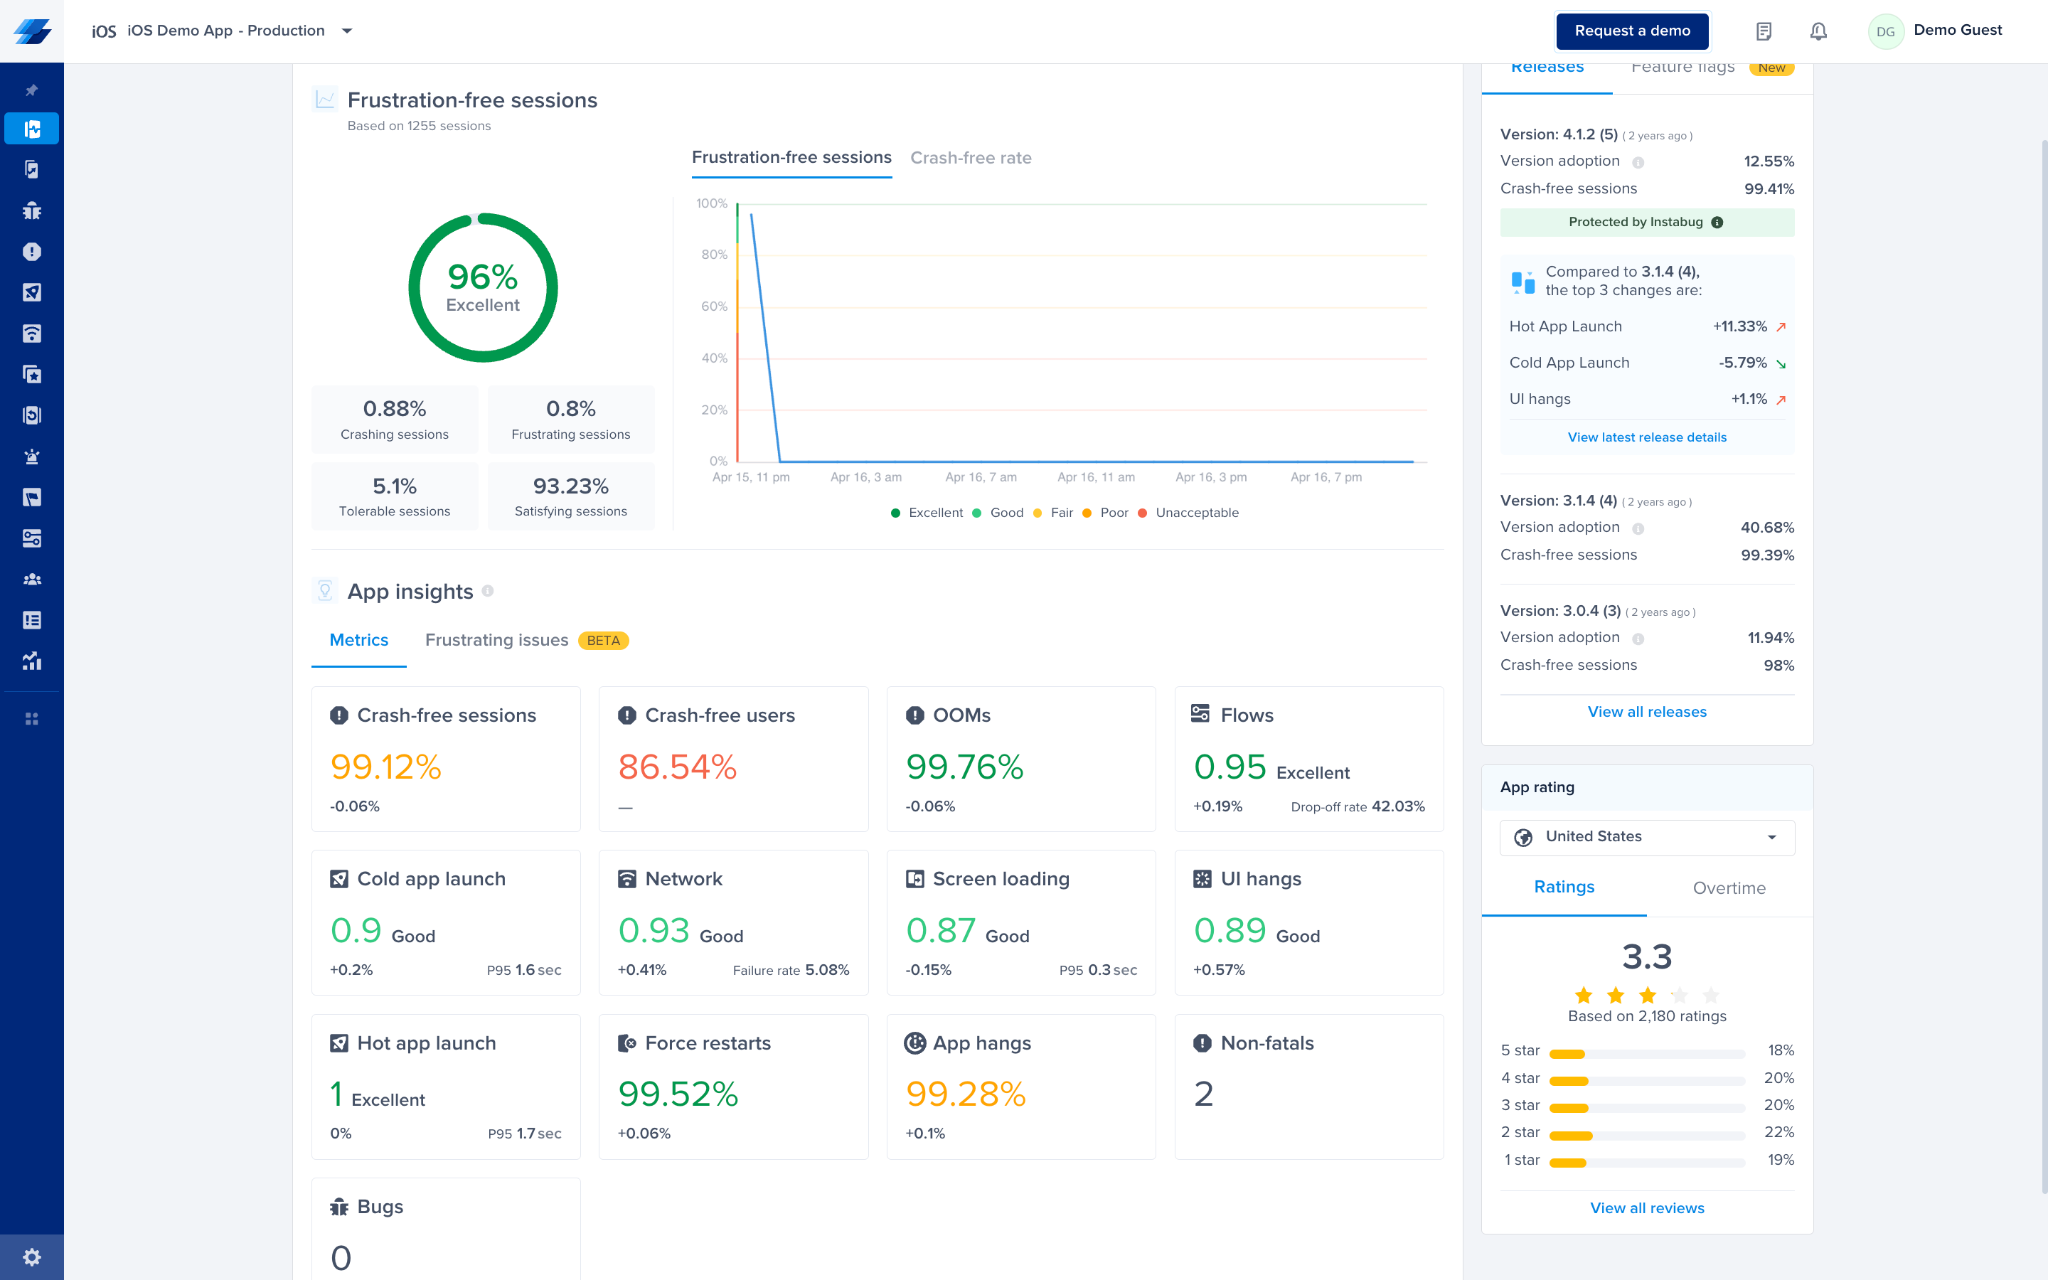
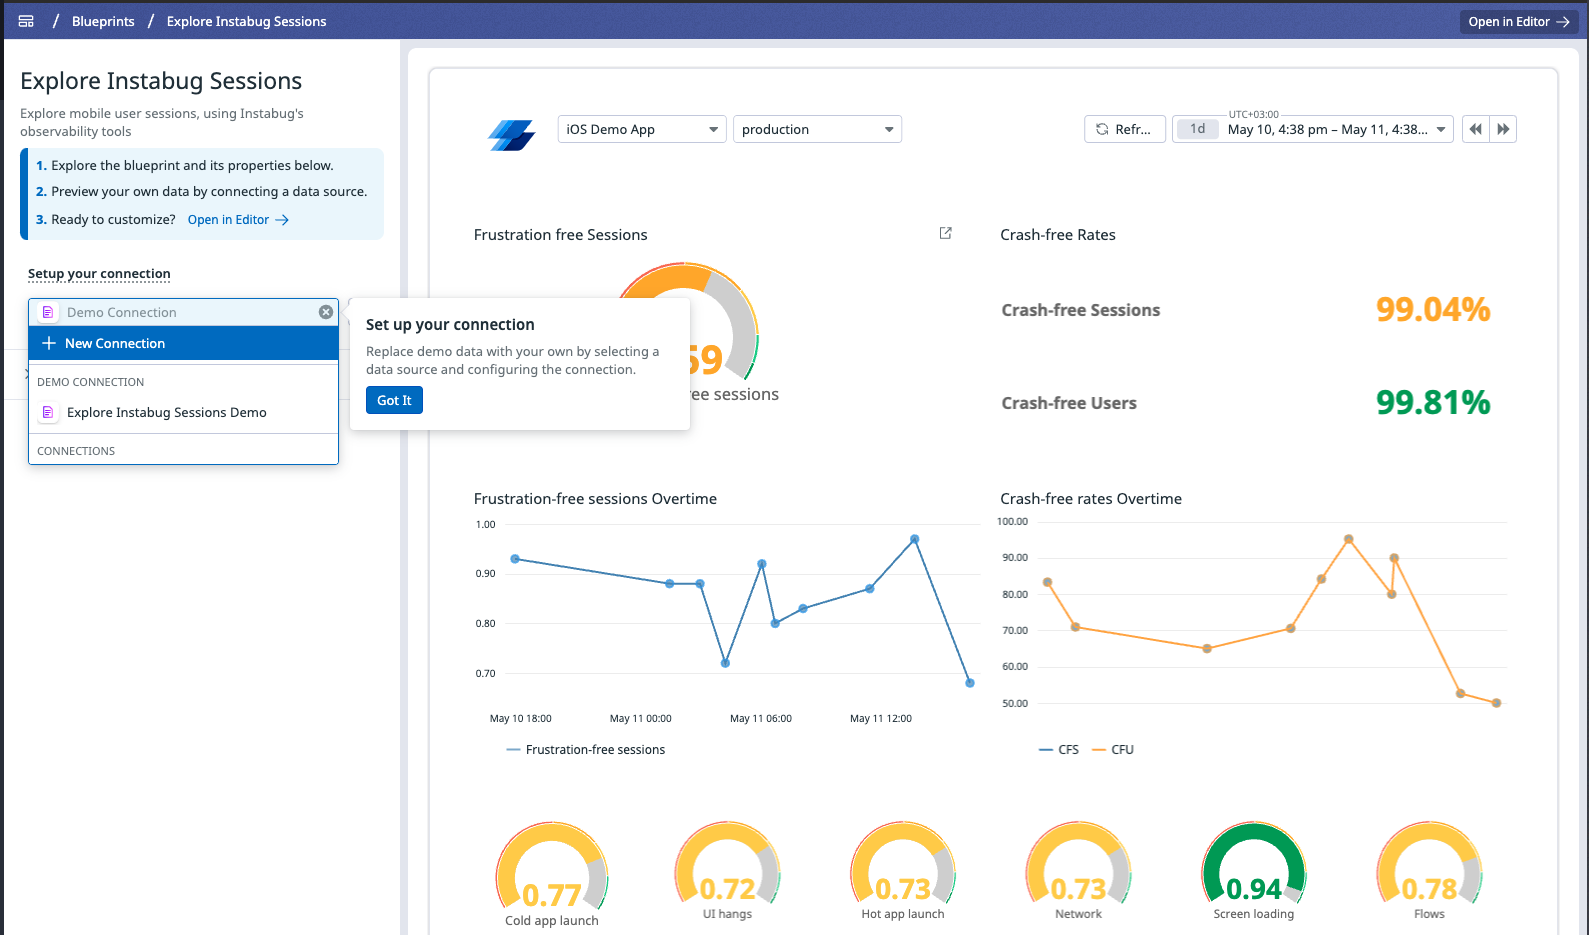
Allows customers to view their Instabug data from a widget on their Datadog account.

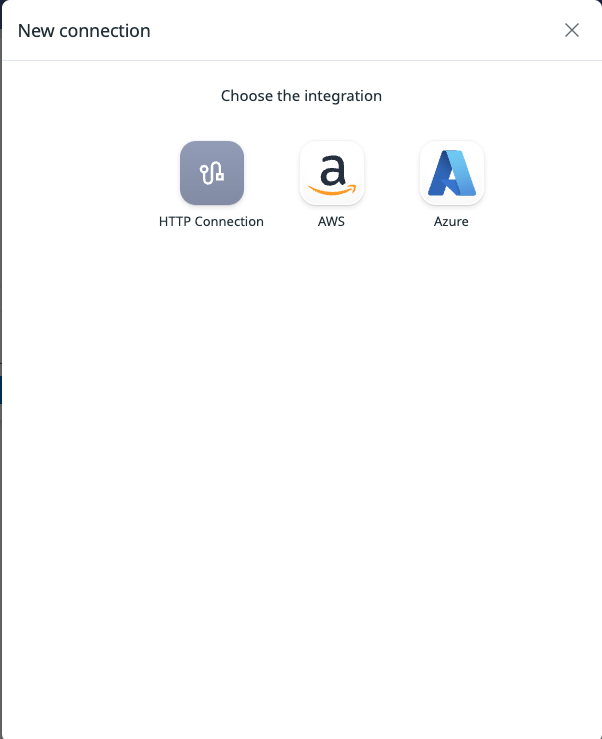
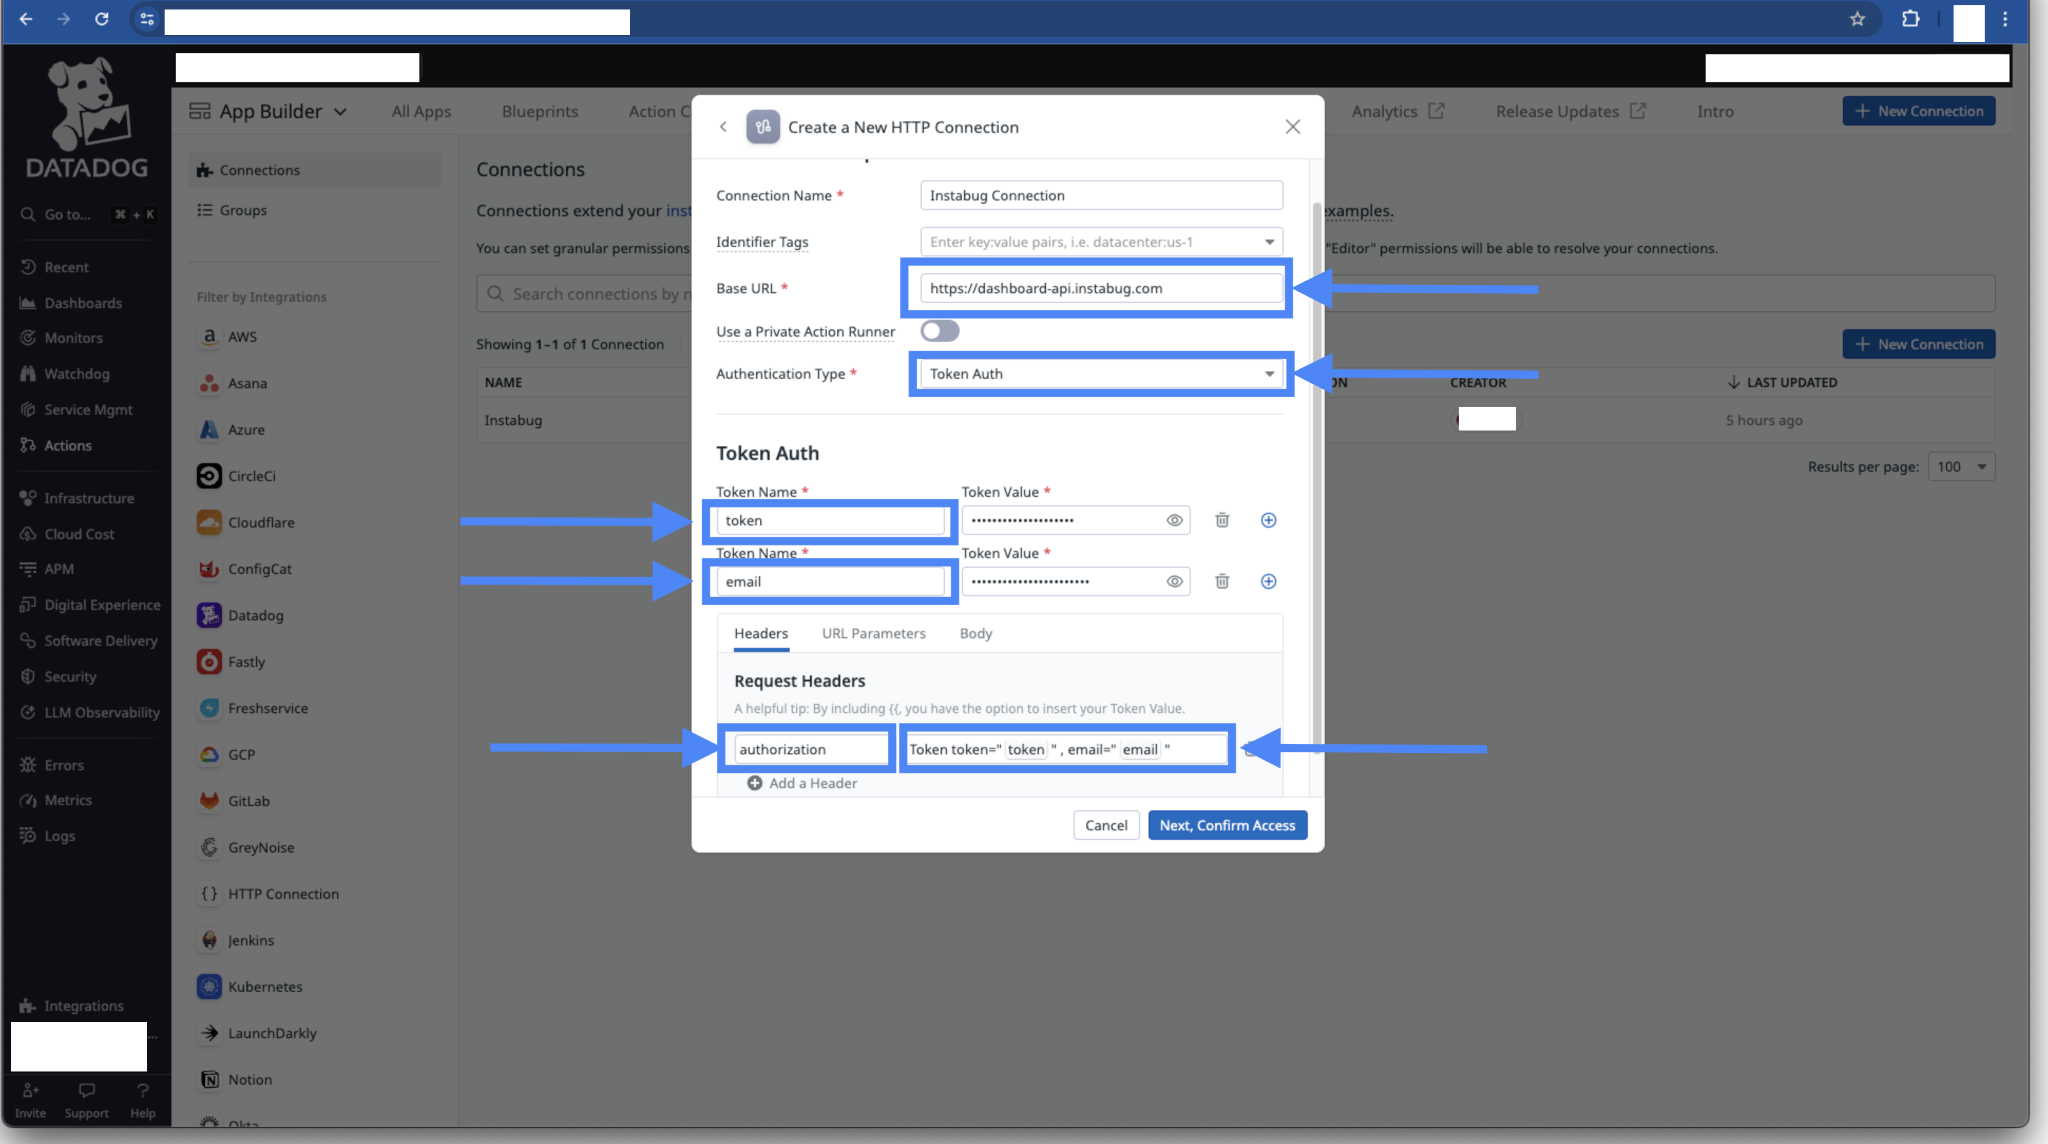
  1. Authentication: You need to log into your Instabug account from the Datadog widget.

  2. You'll be able to check your Instabug data (Bug Reports, Crash Reports, APM Metrics) on the widget per application. You can also go to the Instabug dashboard using the Go to Instabug button.

📘

The date filter is controlled by the Datadog dashboard.

Network Occurrences Integration

To use the Instabug integration with Datadog, ensure the following prerequisites are met in your Datadog setup:

  • Ensure that your Datadog plan includes distributed tracing.
  • Use a Datadog agent that supports W3C context propagation. Most new versions support this feature.
  • Distributed tracing must be enabled in your backend agent. This should be enabled by default. For more information, refer to the Datadog documentation.
  • Ensure that you give priority to tracecontext in your agent by setting it as the first element in the priority array of propagation_extract_style. For detailed instructions, refer to the Datadog documentation.


    Example in Ruby:
    Datadog.configure do |c|
      # List of header formats that should be extracted
      c.tracing.propagation_extract_style = [ 'tracecontext', 'datadog']
    end
    

📘

Note: if you use any trace sampling algorithms, Datadog may drop some traces. Consequently, you might see network requests in Instabug that are not available in Datadog.

You can also integrate Instabug with Datadog to view the network occurrences you have on Instabug with their equivalent on Datadog. All you have to do is the following steps:

  1. Click on Datadog's icon either from Instabug's integration list or any occurrence inside the occurrences page of the Network Performance Monitoring.

  1. Sign in to your Datadog’s dashboard and add https://app.datadoghq.com to the URL field. If your company uses Datadog's custom domains, use the custom domain instead of https://app.datadoghq.com. Note: If you'll be redirecting to multiple organizations from the same app, keep app.datadoghq.com as is.

    Disclaimer: By setting up this integration, Instabug will attach a traceID as an HTTP header to your network requests.

  2. After clicking “Continue” in the previous step, click on “Test integration” and we’ll test the integration and make sure that there are no typos in the URL you’ve added.

  3. You can now choose the integration name and check the products that you want to integrate with. For now, we only offer integration with Network Performance Monitoring, but more is coming soon.

  4. Almost done! The last step would be to align with your backend team to configure Datadog to capture the Instabug traceID that we attach with every request from the server side sent from the mobile app using different web frameworks:

    • Express: If you are using Express Server, you can add the below code snippet to allow the Datadog tracer to trace this header:

       //Tracer initialization
       const tracer = require('dd-trace').init({
         logInjection: true
       });
      
       //Express server
       tracer.use('express', {
         headers: ['IBG-TRACE-ID']
       })
      
    • Fastify: If you are using Fastify, you could add the below code snippet to add a hook for all your requests during the pre-handler phase to report a span with the ibg-trace-id that gets parsed from the request headers:

      fastify.addHook('preHandler', async (request, reply) => {
         const ibgTraceId = request?.headers['ibg-trace-id'];
      
         const span = tracer.startSpan('name_name'); // you could change it to any other name
         if (request.headers['ibg-trace-id']) {
           span.setTag('http.request.headers.ibg-trace-id', request.headers['ibg-trace-id']);
         }
         span.finish();
       });
      
    • Others: If you are using any other BE stack, you need to create a span based on Datadog's docs and set a tag called http.request.headers.ibg-trace-id with the value parsed from your request context's header ibg-trace-id.

    Relevant Datadog docs: Getting Started with Datadog & Documentation for dd-trace

  5. All Set! Now, when you check any of the network occurrences on Instabug that are also on Datadog and have Instabug’s traceID attached, you'll be able to click on "View on Datadog" and get directed to the exact occurrence on your Datadog dashboard.

Notes:

  • You’ll be able to see the “View on Datadog” button for new occurrences that come after updating the SDK to the supported versions and configuring the integration on the dashboard.
  • You might find some occurrences with no “View on Datadog”. This is because these occurrences are either not on Datadog, or they don't have Instabug's traceID attached.

📘

This feature is supported on SDK versions 12.4.0 or above on iOS & Android.

Datadog Marketplace

You can find Instabug in Datadog’s Marketplace listing, which offers SaaS licenses to enable you to subscribe to Instabug directly through Datadog Marketplace.