
Alerting for Performance Metrics
How to get notified on your performance metrics.
Instabug App Performance Monitoring is continuously monitoring application performance on the client-side, giving you insights on the following metrics:
- App launch times
- Client-side network health & latency
- Screen loading time
- UI hangs
- Flows
These metrics directly impact the user experience, helping you identify performance issues before they affect more users. Instead of paying regular visits to the dashboard to check for any performance issues, you can set up alerts to immediately get notified on Slack or email about any performance drops.
Alerts and Rules
To get started with setting up performance alerts, hover over the left navigation pane and click on “Alerts & Rules”

Alerts and rules from the Instabug menu
Now you can see a full list of all alerts & rules that you previously set up (if any), get started and create a new rule/alert by clicking on the “Create” button

Click on "Create"
Alert types
Select the performance metric:
You can set up alerts for each of the performance metrics individually, under the “For” , select the performance metric of interest from the dropdown list
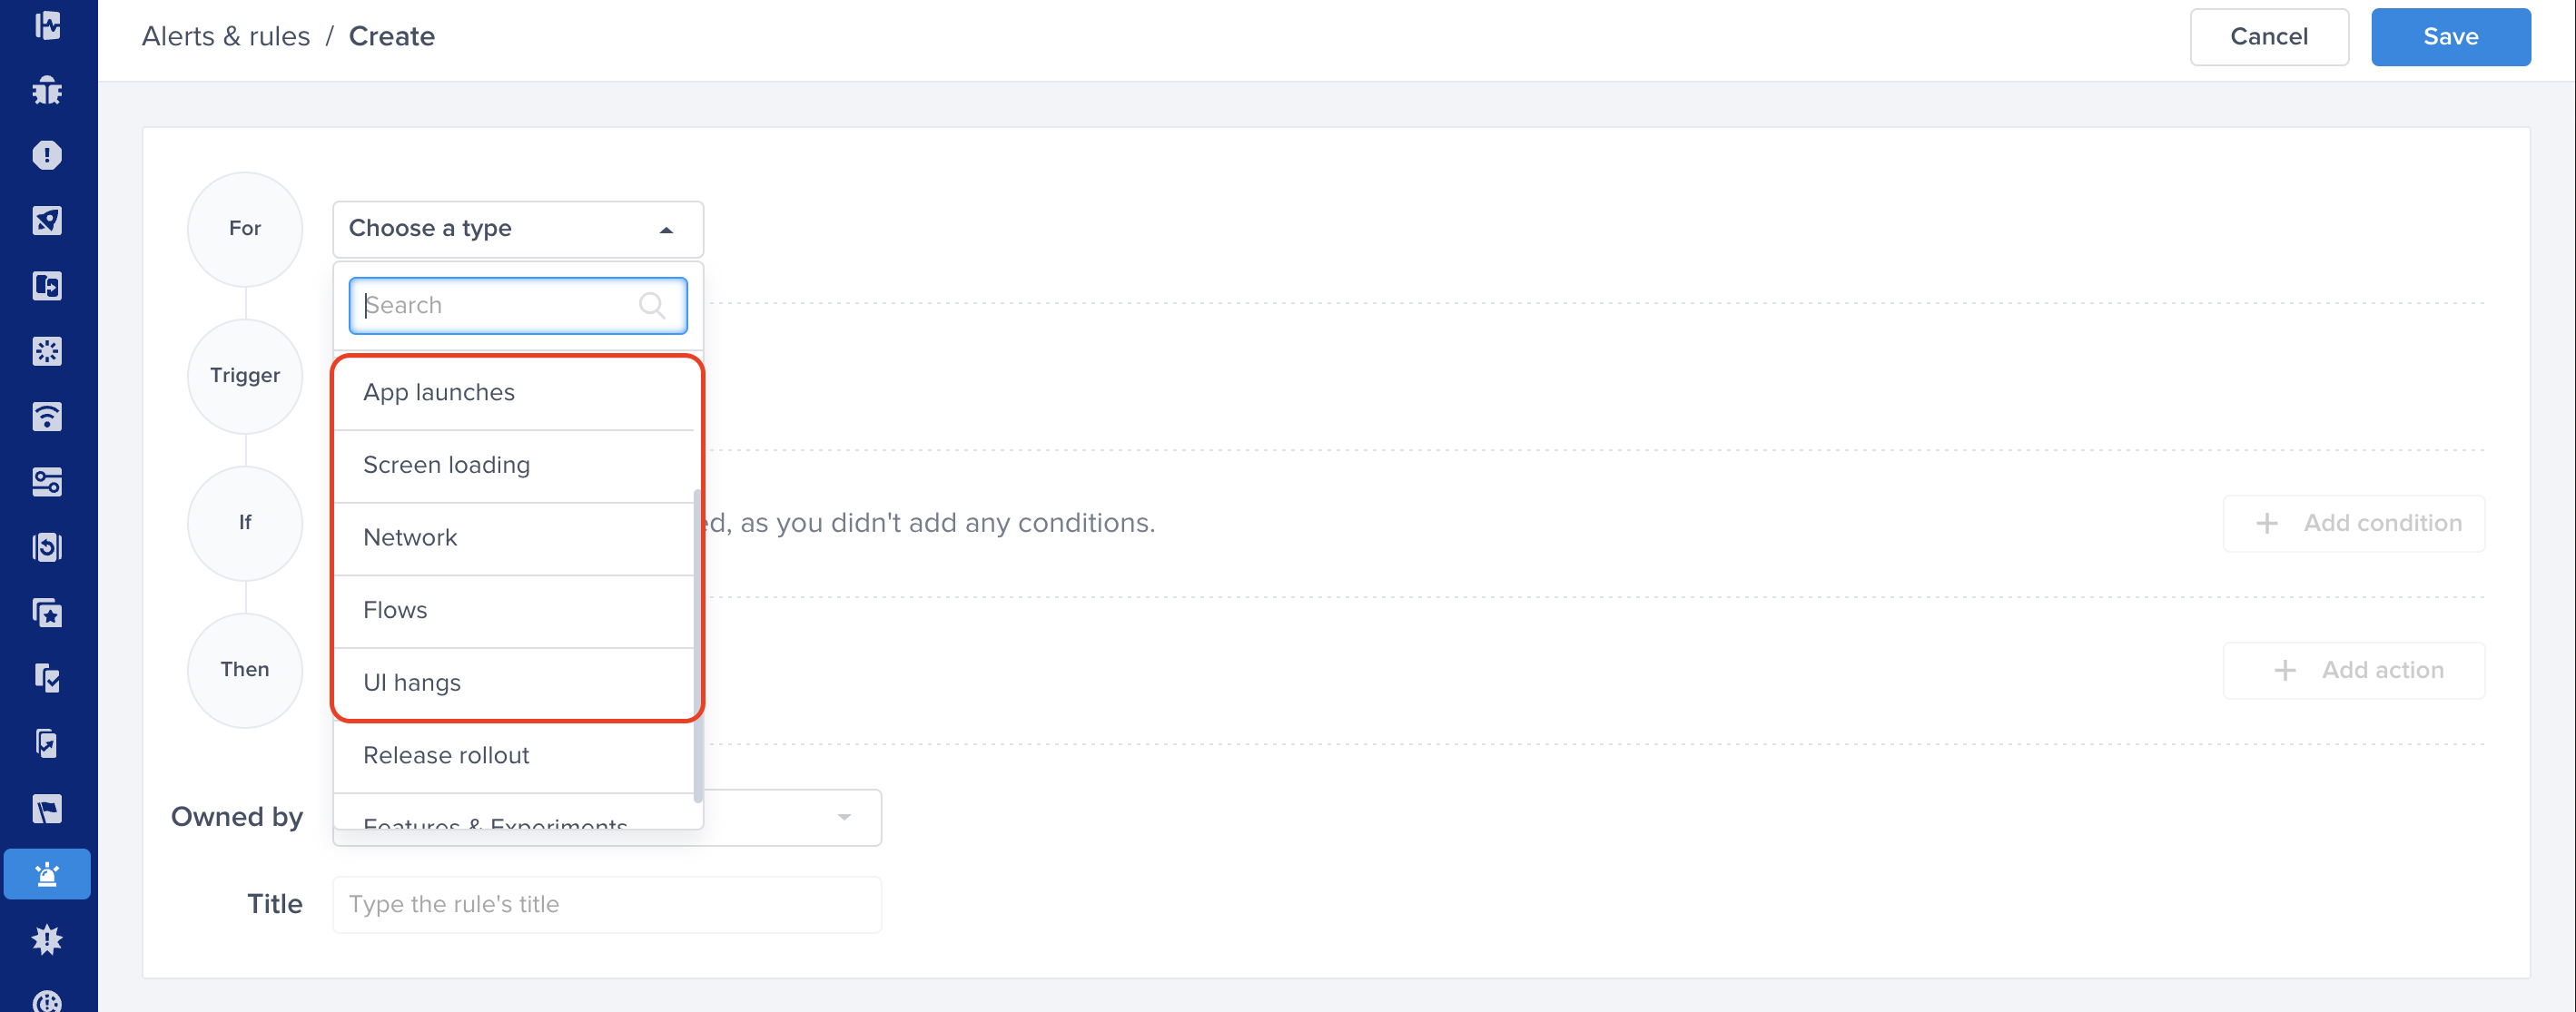
Choose the relevant performance metric for which you want to be alerted
Let’s choose “Network” as an example, then you need to select the trigger that you want to be notified for (triggers vary based on the selected performance metric*)
Alert triggers
The alert trigger can be one of the following:
P95 (95th percentile): The maximum latency encountered by 95% of the users for the selected metric
- Insert the desired threshold that you want to get notified about if exceeded (3 sec for example)
- Select the time range that you want to be taken into account for this alert

Choose the trigger and time range - Example P95
Apdex change rate: Get notified whenever your Apdex score changes by a certain percentage over a
specific period of time.
- Insert the desired threshold for the Apdex change rate, the below example will notify you when the
Apdex score drops by 10%
- Select the time range that you want to be taken into account for this alert

Choose the trigger and time range - Example Apdex change rate and time range
Failure rate (network only): Get notified whenever failure rate for network requests exceeds a certain
threshold
- Insert the desired threshold for network failure rate, the below example will notify you when network
failures exceeds 10%
- Select the time range that you want to be taken into account for this alert

Choose the trigger and time range - Example Failure rate and time range
Apdex: Get notified whenever the Apdex score for the selected performance metric drops below a certain
threshold
- Insert the desired threshold for the Apdex score, the below example will notify you if Apdex dropped
below 0.7
- Select the time range that you want to be taken into account for this alert
For more information on Apdex definition and calculation, please check the docs here

Choose the trigger and time range - Example Apdex and time range
Alerts conditions
After setting the triggers for alerting, you can also add some conditions, these conditions need to be met in order to fire this alert (conditions vary based on the selected performance metric*).
You can specify the desired conditions under the “If” section, click “Add Conditions” to select from the available conditions. You can add as many conditions to fulfill your use case.
Note: If you didn’t add any conditions, the rule will apply on the selected metric when the number of occurrences exceeds 100
Below is a list of available conditions:
- App version: If you are interested in monitoring a specific app version (e.g your latest release or top releases)
- Trace name: This can be a specific screen name, network URL or a flow that you want to monitor (e.g home screen, payment API or checkout flow)
- Key metric: Choose to get notified only on metrics that you define as “Key metrics”, or the ones that are not. See more info about key metrics here
- Count: Define a threshold for the occurrences count of the selected metric that needs to be met
- Method: This applies on network alerting only, you can select the network request method as a condition for the alert (GET, PUT, POST, PATCH, DELETE)
- Launch Type: This applies on app launch only, you can select between cold or hot app launches
Example: The below rule will fire an alert when the P95 exceeds 3 seconds within 1 day, the alert will be fired only when all the conditions are met

Choose the condition that should be checked to get alerted
Alerting channels
Alerting for performance events is currently supported through Slack, MS Teams and Emails. You can select multiple channels for a single rule

Forward your alert to slack
Finally, all you need to do is assign this rule to your team (optional for ownership), provide a title for the rule and click “Save”

Optional - Choose the team that is responsible for this alert. And click "Save"
The below matrix shows the different triggers & conditions for each metric
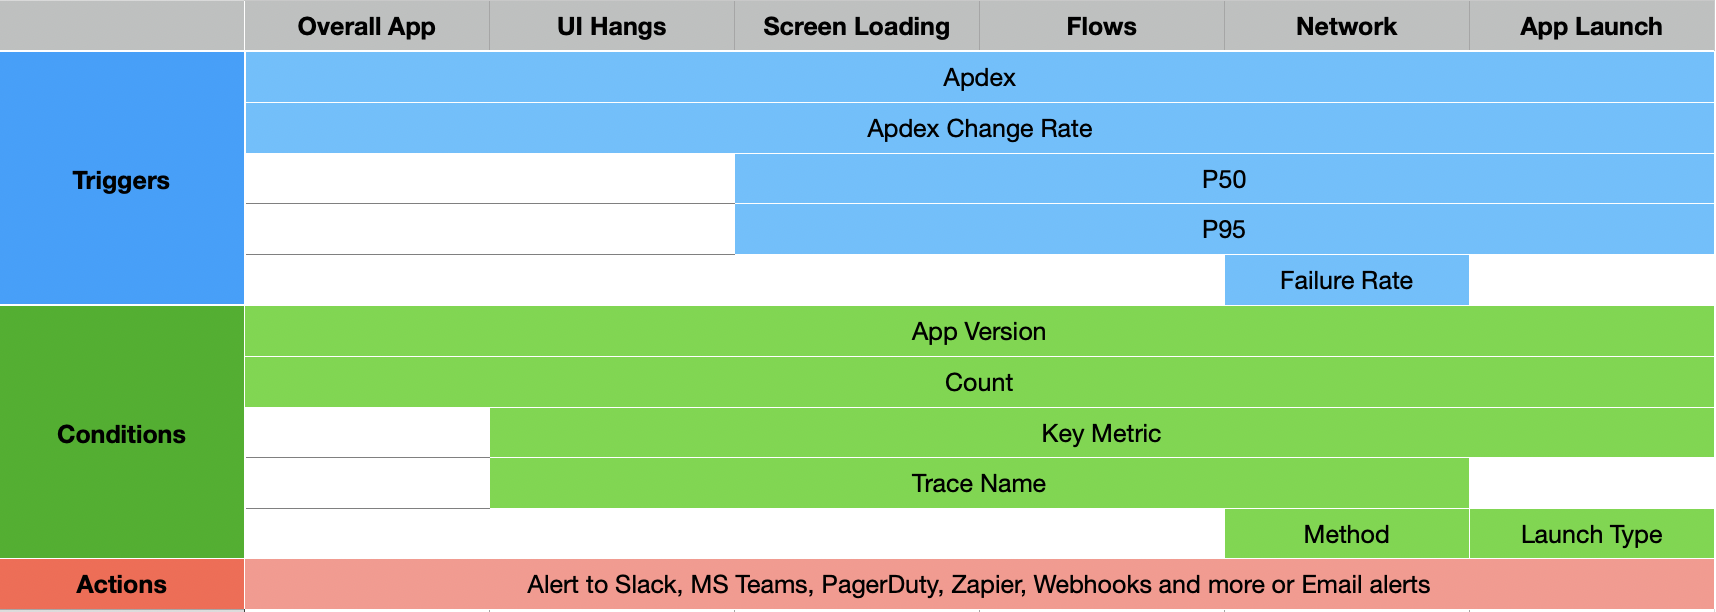
Triggers, conditions and Actions
Updated about 1 year ago