
Dynatrace
Overview
The new Instabug integration with Dynatrace enables end-to-end tracing for network calls, connecting client-side and server-side monitoring for your network requests. By using a unique trace ID, you can follow any network request from the client to the server, providing insights for troubleshooting networking issues.

Prerequistes
Dynatrace
To use this integration, ensure the following prerequisites are met in your Dynatrace setup:
- Supporting for W3C Context Propagation: Have W3C enabled. W3C Trace Context support is available as an Early Adopter Release (no registration required) beginning with Dynatrace version 1.180.
- You can enable this on Dynatrace through Settings > Server-side service monitoring > Deep monitoring > Distributed tracing.
Instabug
- Supported Platforms: This integration is only supported for iOS and Android.
- Instabug SDK Version: Ensure you have a minimum SDK v13.2.0 or higher on either iOS or Android.
Integration Steps
By setting up this integration, Instabug will attach a trace ID as an HTTP header to your network requests. This allows us to link network requests from Instabug to New Relic.
Go to Settings -> Integrations -> Dynatrace in your Instabug dashboard, and follow these integration steps:
-
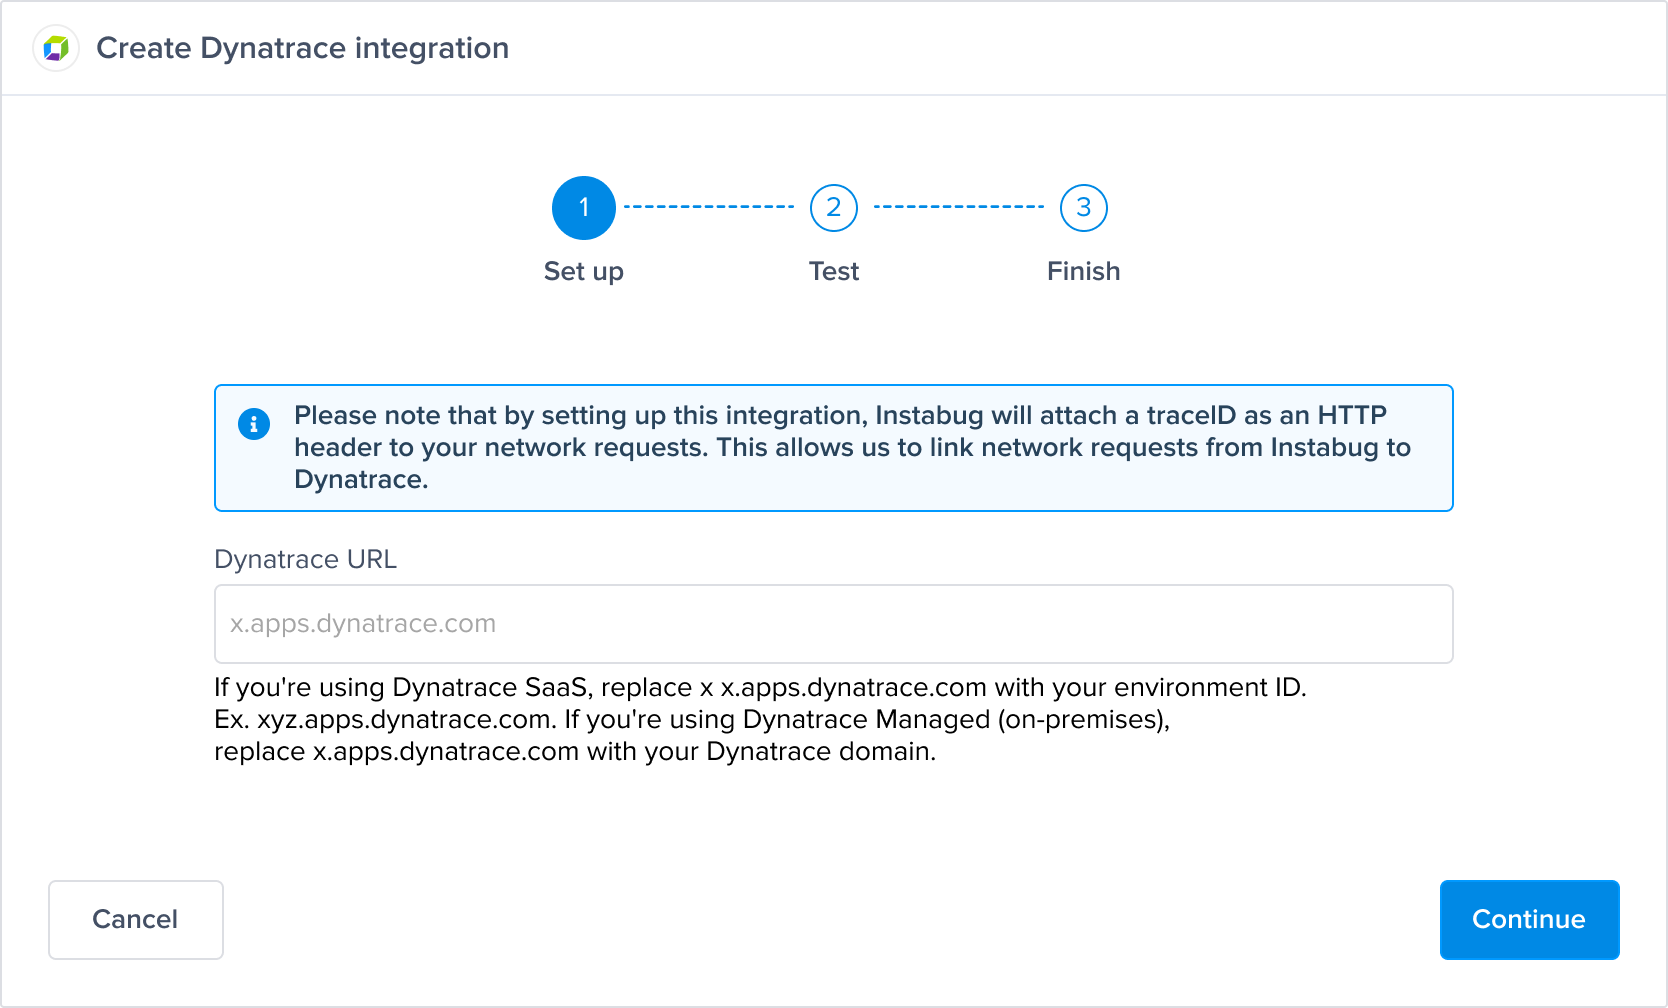
Set Up:
-
Enter your Dynatrace dashboard link.
- If you’re using Dynatrace SaaS, replace x in
x.apps.dynatrace.comwith your environment ID. - If you're using Dynatrace Managed (on-premises),
replace x in
x.apps.dynatrace.comwith your Dynatrace domain.
- If you’re using Dynatrace SaaS, replace x in
-
-
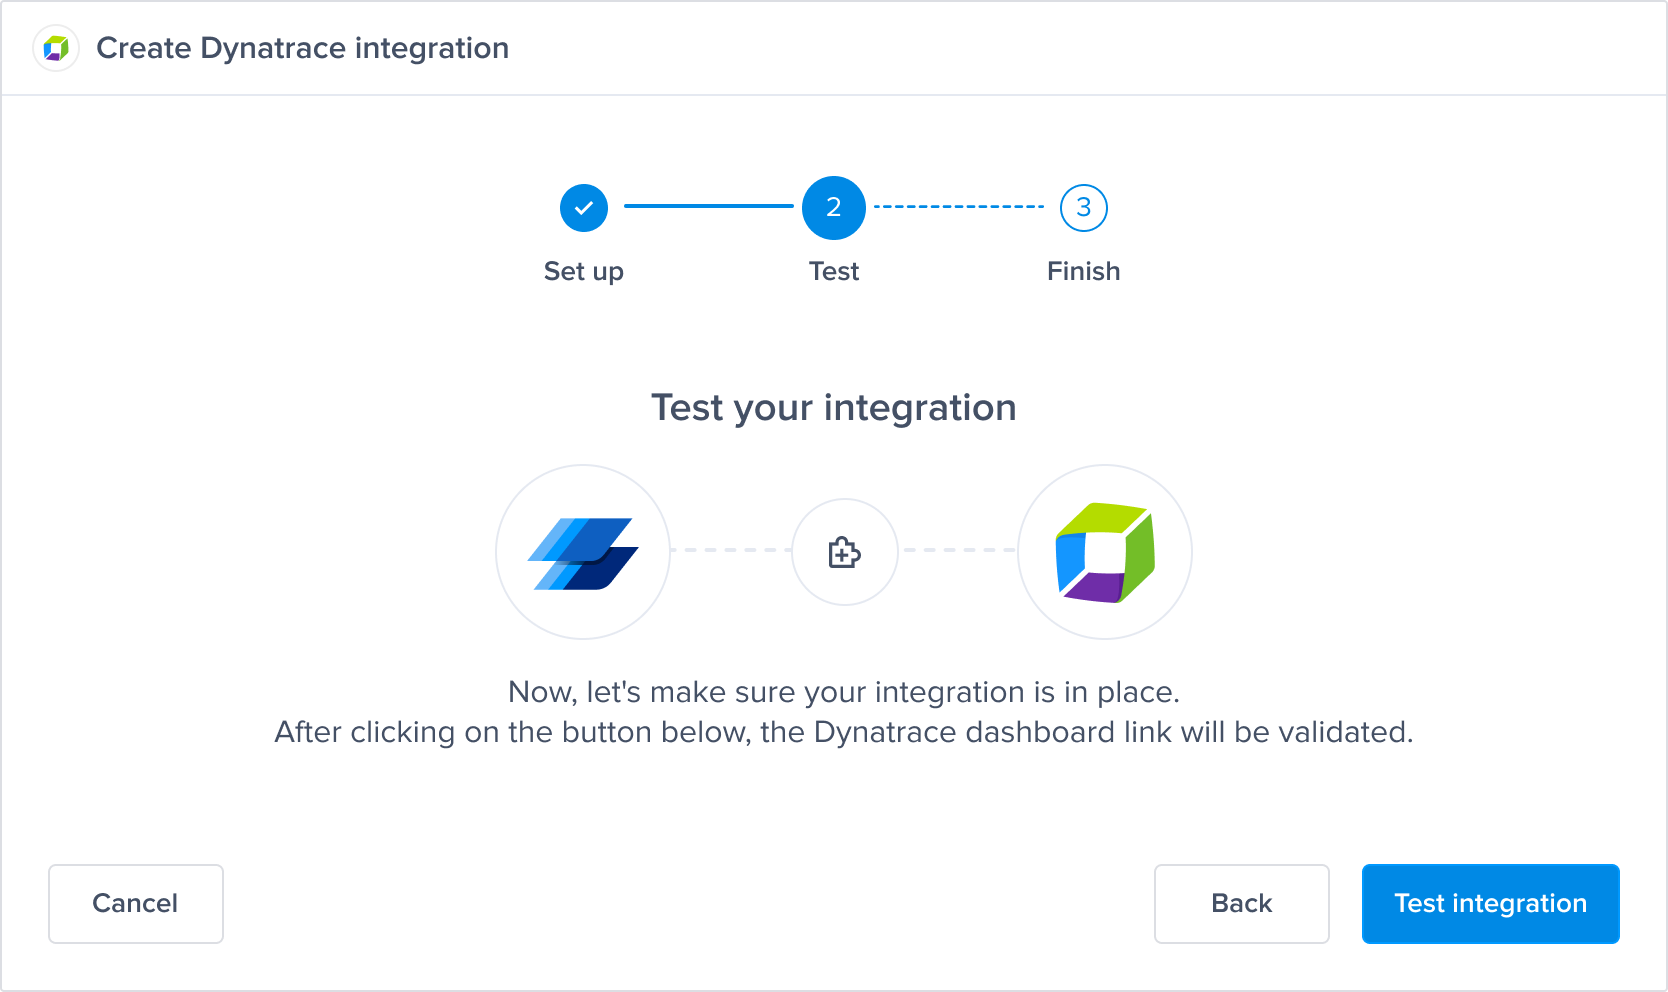
Test:
- Validate the Dynatrace dashboard link to ensure it is correct.
-
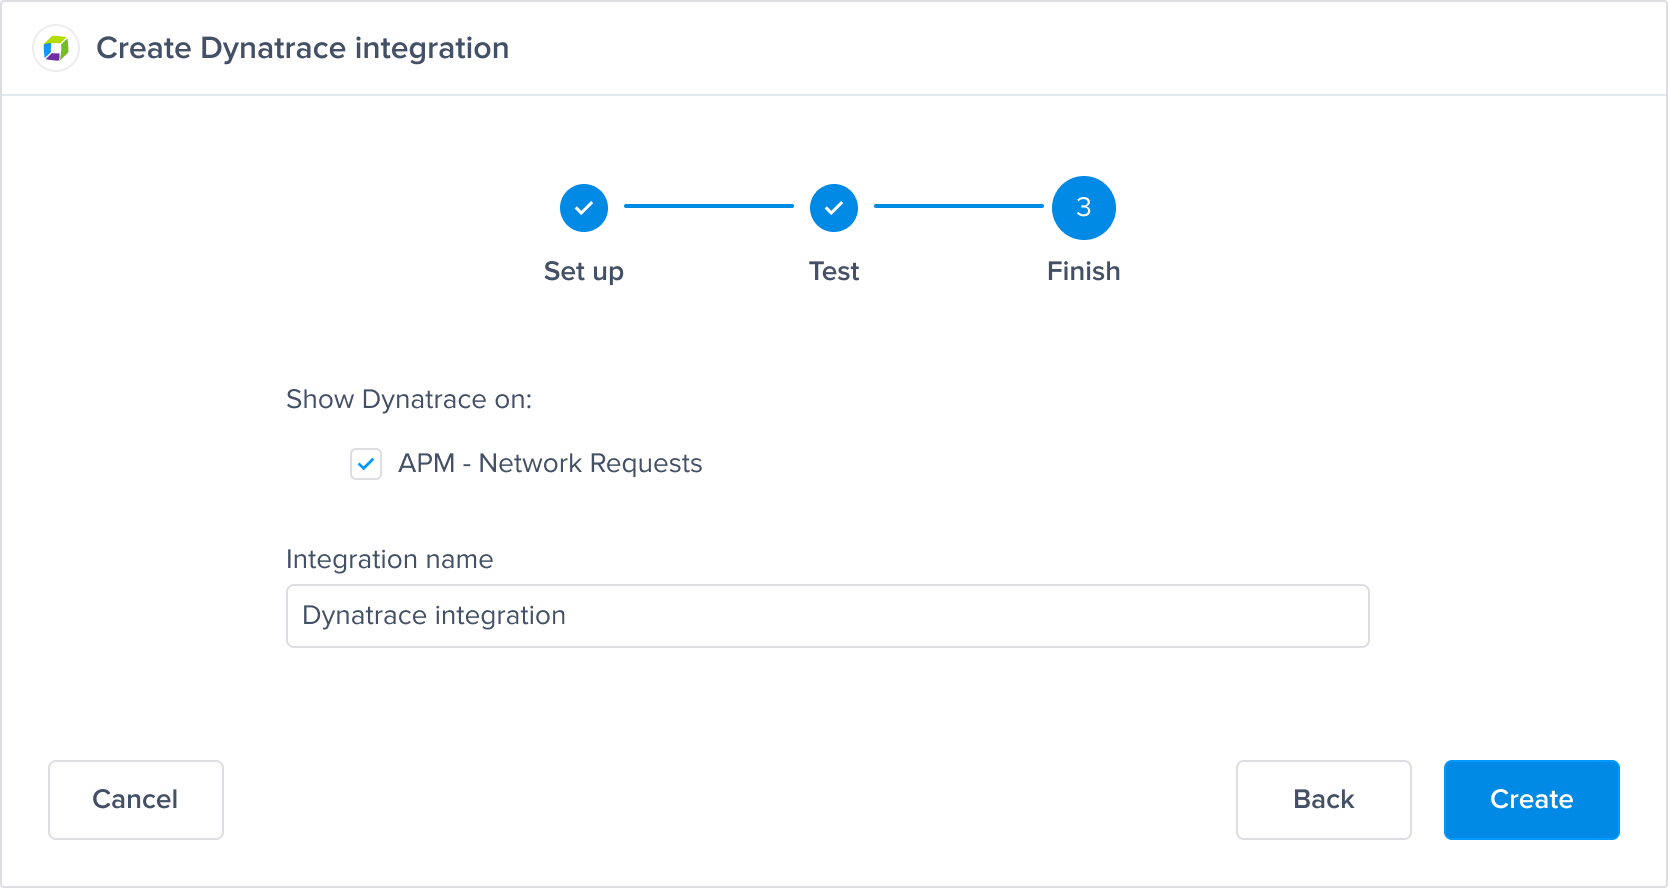
Finish:
- Ensure the APM - Network Requests checkbox is checked to trace network requests to Dynatrace.
- Give your integration a name and save the integration.
Using the Integration
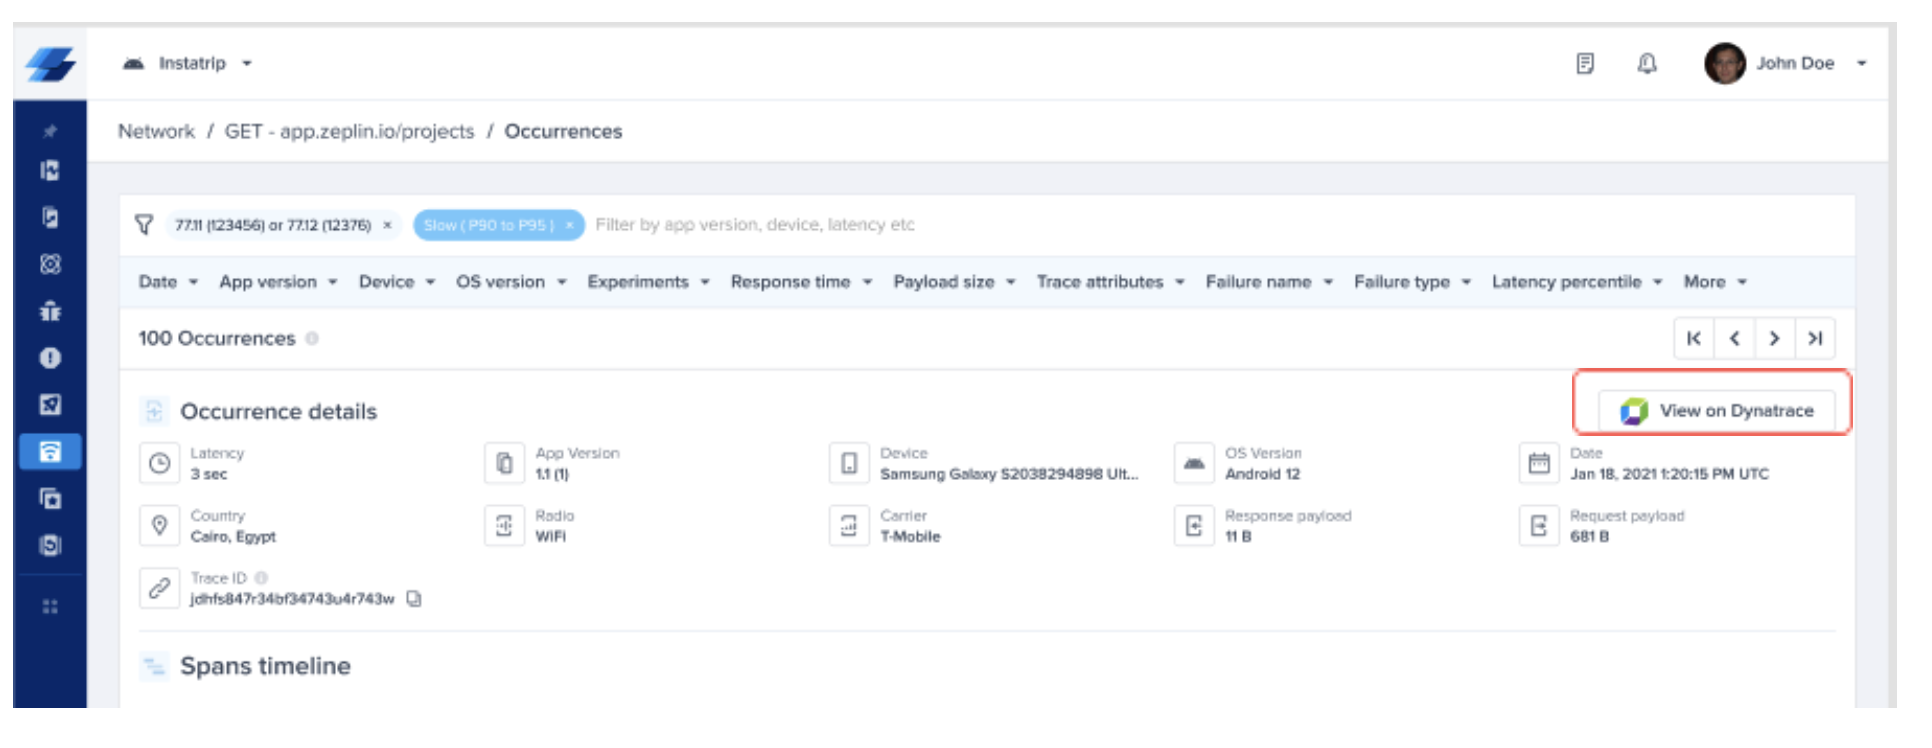
When a network occurrence is logged, a unique trace ID will appear on the occurrence page in the Instabug dashboard.
Navigate to any network occurrence received after you created the integration, click on “View on Dynatrace” to view the same network occurrence on your Dynatrace dashboard.
Updated 6 months ago