Execution Traces for iOS
This page helps you get started with Instabug's execution traces monitoring on iOS, understand apdex calculation, add custom trace attributes, and customize your targets.
Execution Traces is now Flows!
Execution Traces will be deprecated soon, please upgrade your Execution Traces APIs to the new Flows APIs here.
Custom App Traces give you the flexibility of monitoring the performance of specific logic in your app. Via our SDK's API, you define the start and end of a trace and Instabug reports on its latency.
For example, you can monitor how long it takes to process and present the data you received from your server, fetching data from your local database, or maybe the time it takes to compress a file.
Create Trace
It is as simple as defining the trace's name, calling an API to start tracking and doing another call to stop tracking when the task is over.
Instabug automatically aggregates the data of occurrences that are sharing the same trace name. It is worth mentioning that:
- You can run several traces with different names in parallel.
- You can run several occurrences of the same trace (same trace name) in parallel.
- The SDK ignores any trace occurrence that doesn't end. For example, if you start a trace then the user kills the app before it reaches the relevant end statement, this occurrence is ignored to avoid skewing your numbers.
Start Trace
You can use the API below to mark the start of a trace occurrence. It takes as input a trace name that we use to aggregate the data of relevant occurrences together on your dashboard. Please note the following:
- Trace name can be up to 150 characters. Any extra characters are truncated.
- Trace name can't be nil or an empty string.
- Avoid adding any of these special characters [, (, ), =, {, }, <, >, /, , ] (commas not included) as they will be replaced with _.
- Starting a new trace has to be done after initializing the SDK.
Starting a trace occurrence returns an object that you can use later on to end the trace occurrence or add custom attributes.
// Start a trace
let trace = APM.startExecutionTrace(withName: "name")
// Start a trace
IBGExecutionTrace *trace = [IBGAPM startExecutionTraceWithName:@"name"];
End Trace
Use the API below to end a trace occurrence that you have already started:
// End an existing trace
trace?.end()
// End an existing trace
[trace end];
Adding Trace Attributes
Instabug automatically augments any trace with some attributes like app version, os version, and device. You can leverage those attributes on your dashboard to segment, drill-down, and find insightful patterns. For example, you can easily spot if a performance problem is related to a specific device model.
You can use the API below to add your custom attributes to a trace. For example, if you are A/B testing, you can add an experiment attribute.
While setting a new attribute to a trace that you have already created, you pass the attribute's key and value:
- The attribute's key can be up to 30 characters.
- The attribute's value can be up to 60 characters.
- Avoid adding any of these special characters [, (, ), =, {, }, <, >, /, , ] (commas not included) as they will be replaced with _.
- You can add up to 20 unique custom attributes to each trace.
- The attribute's key can't be an empty string or nil.
- The attribute's value can't be an empty string.
- You can call the API twice with the same key to override a previous value.
- Setting the attribute's value as nil clears and removes the attribute.
// Add custom attributes to an existing trace
trace?.setAttributeWithKey("key", value: "value")
// Add custom attributes to an existing trace
[trace setAttributeWithKey:@"key" value:@"value"];
App Traces Apdex
Instabug calculates an Apdex score for your app traces as a way of measuring their performance. An Apdex score ranges between 0 and 1; the higher the value, the better:
- Apdex score ≥ 0.94 equates to Excellent performance.
- Apdex score ≥ 0.85 and < 0.94 equates to Good performance.
- Apdex score ≥ 0.7 and < 0.85 equates to Fair performance.
- Apdex score ≥ 0.5 and < 0.7 equates to Poor performance.
- Apdex score < 0.5 is considered Unacceptable.
How Is the App Trace Apdex Calculated?
When an app trace occurrence is collected, it is flagged based on a pre-defined target (T). An app trace occurrence is considered:
- Satisfying: if its duration ≤ T
- Tolerable: if its duration > T and ≤ 4T
- Frustrating: if its duration > 4T
Then based on the bucketing explained above, the Apdex score is calculated as follows:
- Total occurrences = Satisfying occurrences + Tolerable occurrences + Frustrating occurrences
- Apdex score = (Satisfying occurrences + 0.5 * Tolerable occurrences) / Total occurrences
How Can You Control a Specific Trace's Target?
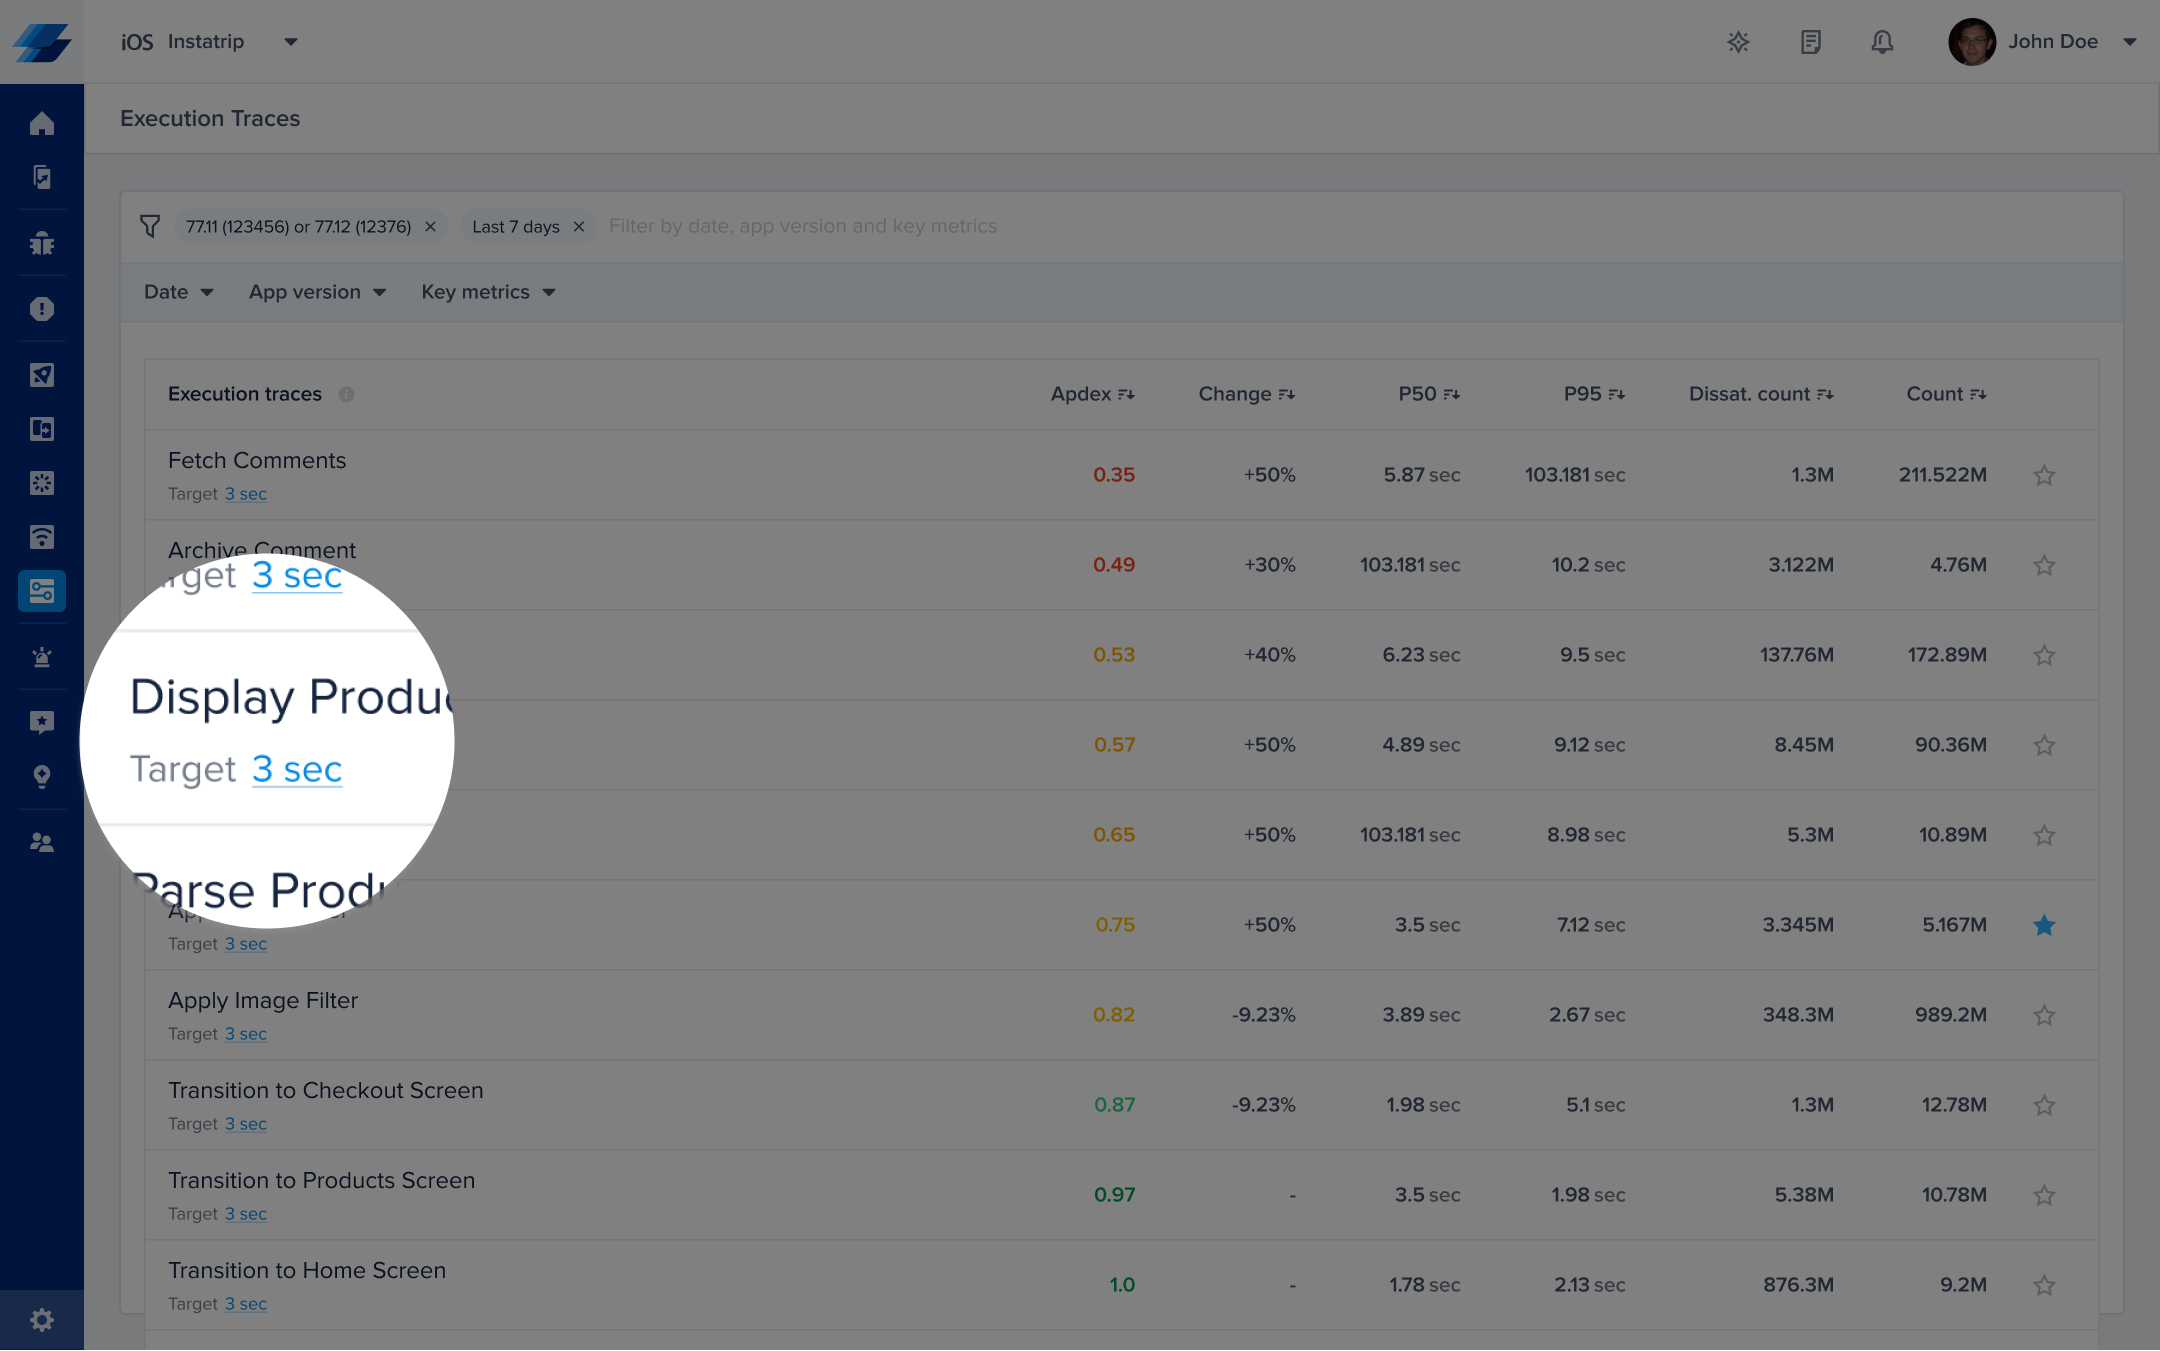
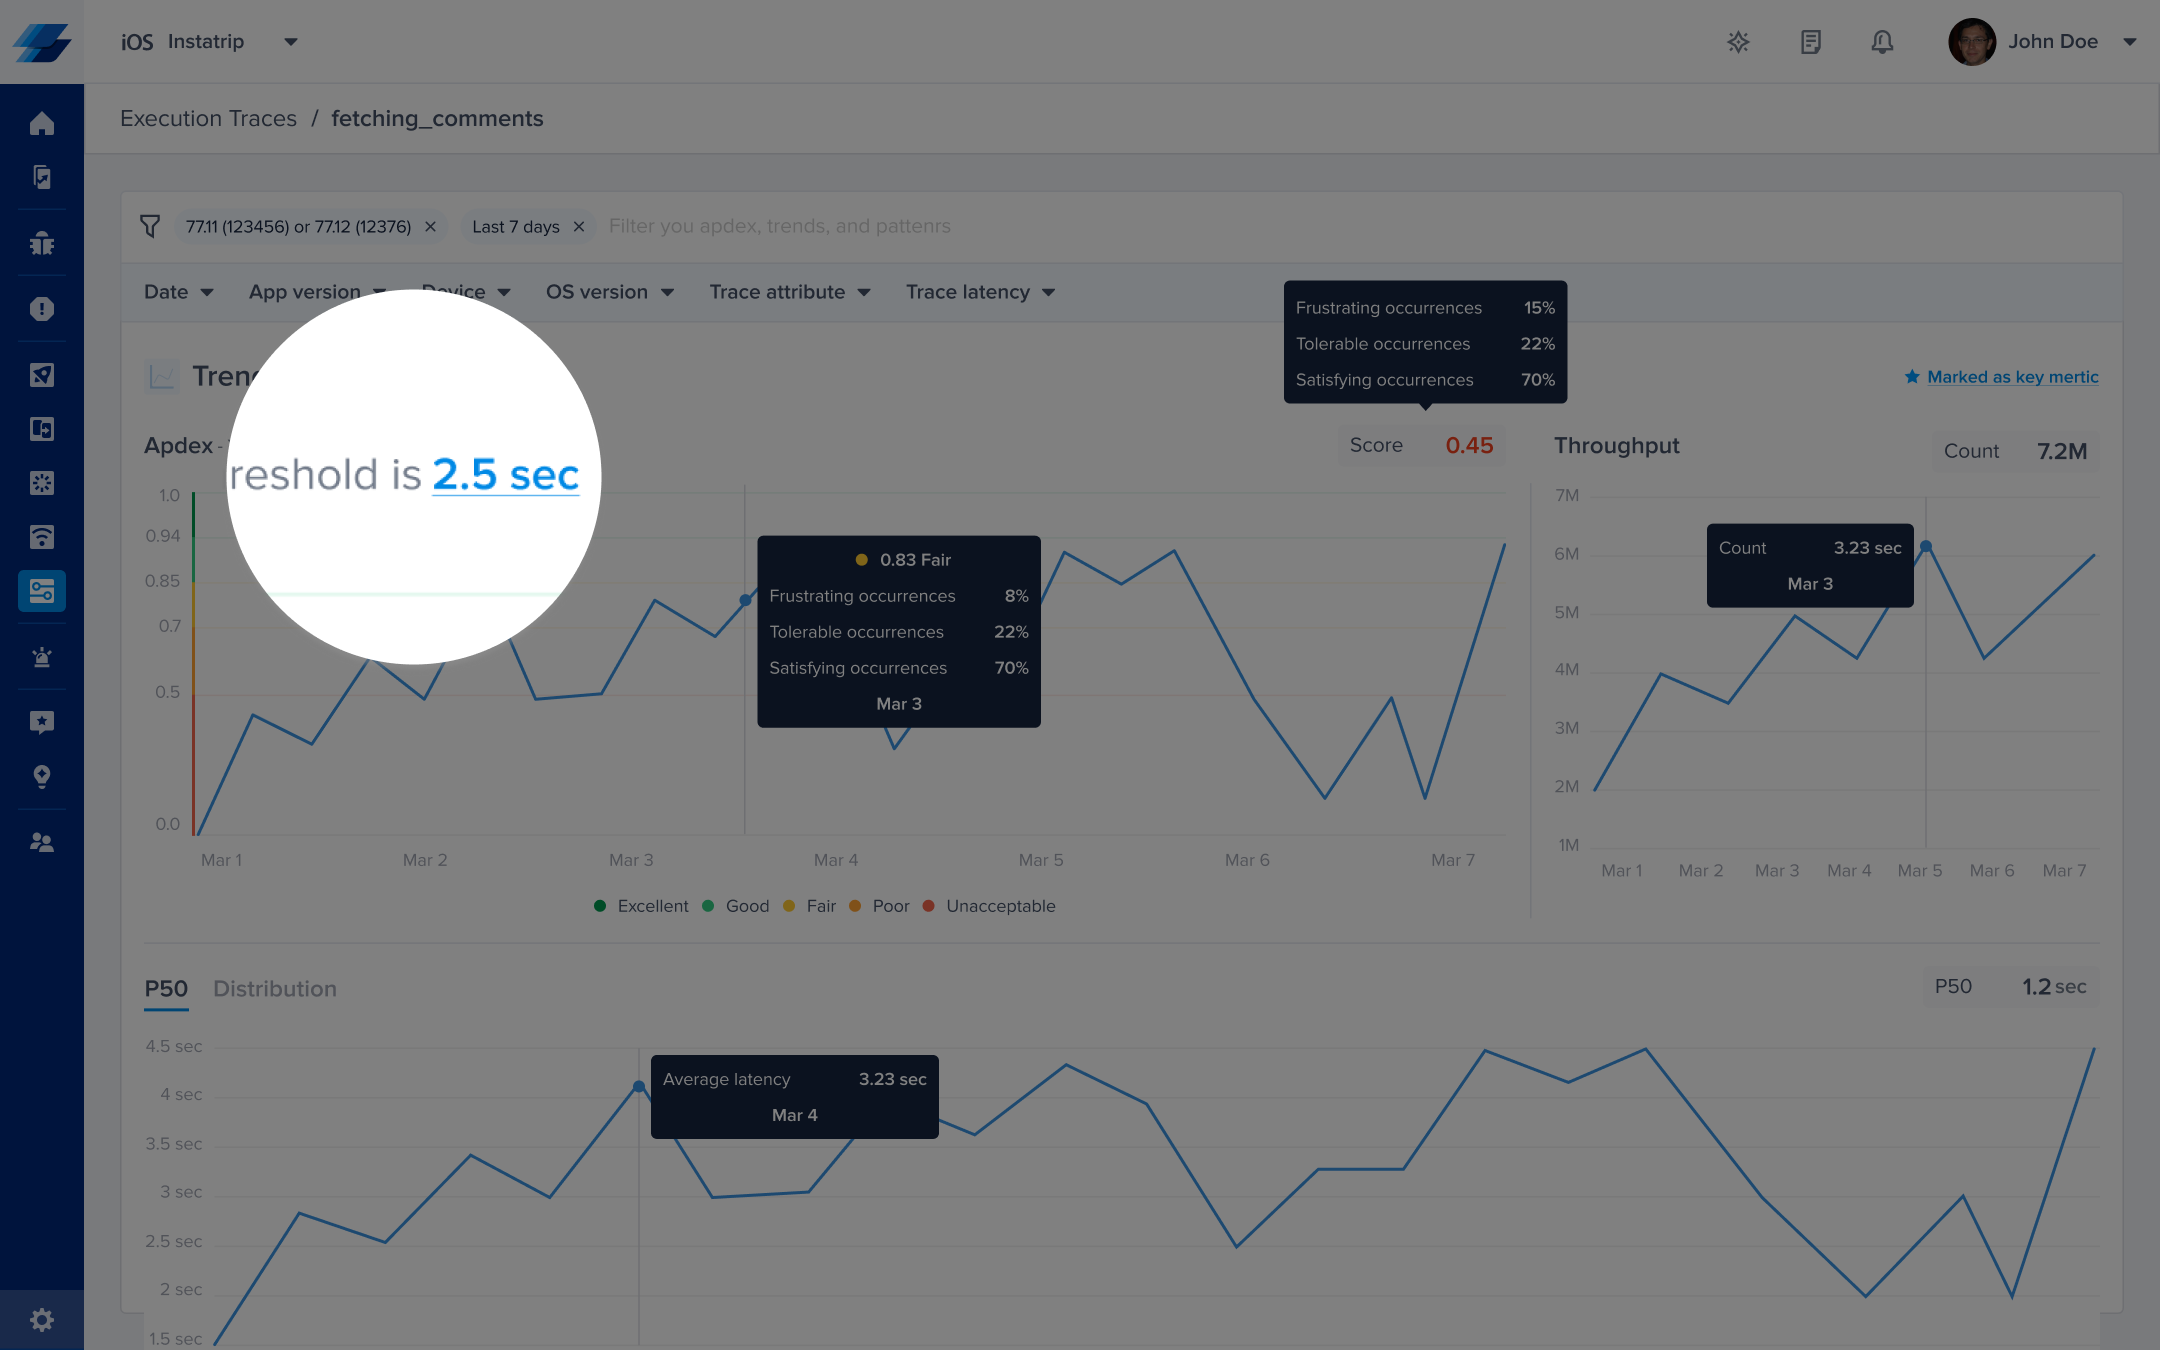
By default, the target is set to 0.5 seconds; however, you can easily change this number from your dashboard by clicking on the action highlighted in the screenshots below.

Click on the target CTA in the list to change the definition of satisfying trace duration.

Or, you can control it from the corresponding details page.
Please note that updating your app trace target does not affect the already stored occurrences, only future occurrences will be flagged using the new target.
Updated about 1 year ago
