
Reporting Crashes for iOS
Covered here are APIs relevant to crash reporting for your iOS app.
Privacy Policy
It is highly recommended to mention in your privacy policy that you may be collecting logging data in order to assist with troubleshooting crashes.
iOS Crash Types
- Crash: Fatal crashes refer to an error or issue that causes the app to terminate unexpectedly, meaning the app completely shuts down and is no longer usable until the user restarts it. These crashes interrupt the user experience, as the app cannot recover from the issue on its own and must be relaunched.
Fatal crashes are the most severe type of crashes, and they generate crash reports that help developers investigate what caused the app to crash. Typically, they occur due to unhandled errors, system conflicts, or serious resource issues. Here are the types of fatal crashes:
- Signal-based crashes: These are crashes triggered by low-level system signals, typically due to issues like segmentation faults or accessing invalid memory. Common signals include SIGSEGV, SIGBUS, and SIGABRT.
- Exception-based crashes: These occur when an unhandled exception (such as NSException) is thrown, causing the app to crash. This can result from incorrect logic in the app or unhandled edge cases.
- Objective-C runtime errors: Crashes that occur due to issues with the Objective-C runtime, such as unrecognized selectors (when a message is sent to a nil object or invalid object). These crashes happen when the app is trying to follow instructions, but one is missing or wrong.
- OOM: Out-of-memory crashes occur when the app uses more memory than the device can provide, causing the system to terminate the app to free up resources. Common causes of OOM crashes include: Memory leaks, Heavy resource usage, and Retaining too many objects.
- Non-Fatal: Non-fatal crashes refer to an error or issue that occurs in the app but doesn’t cause the app to completely shut down or crash. Instead, the app encounters a problem, such as an exception or unexpected behavior, but is able to continue running without quitting. Non-fatal crashes are useful for developers because they provide insights into bugs or problems that need fixing before they turn into full-blown crashes.
With Instabug Crash Reporting there are two ways to have your application report a crash; either automatically or manually. After the crash is sent to your dashboard, you can easily sort and filter for specific crashes.
Automatic Crash Reporting
If you enable Crash Reporting, crashes will automatically be reported to and viewable from the crashes page of your Instabug dashboard.
You'll also see the trends covering the previous 7 days, including:
- Crash-free sessions: the percentage of sessions that ran and concluded without any fatal errors.
- Crash-free users: the percentage of users that haven't encountered any fatal errors.
- Crashing sessions: the number of sessions that ran and concluded with a fatal error.
- Affected users: the number of unique users who had one or more sessions that ended with a fatal error.
- Total number of occurrences: by hovering on it, you’ll get a breakdown of the total number of fatal sessions, the total number of OOM sessions, and the total number of non-fatal sessions.
If there is a sharp decline in the crash-free sessions rate, an email will be sent to notify you.
This is the crashes page of the Instabug dashboard.
C++ Crashes
The Instabug SDK also supports and captures C++ crashes.
Out of Memory Crashes
By default, if Crash Reporting is enabled, Instabug captures OOM crashes, however, the crashes will not contain a stack trace and will only be captured if they happen while the app is in the foreground.
You can disable/enable capturing OOM crashes using the following API:
CrashReporting.OOMEnabled = false
IBGCrashReporting.OOMEnabled = NO
Force Restarts
Starting from SDK version 11.1.0, Instabug automatically reports Force Restarts. A Force Restart is when a user force terminates your application and re-launches it within 5 seconds, which could indicate performance issues.
Please note that Force Restart reports will not contain a stack trace.
App Hangs
Starting SDK version 10.13.0, Instabug automatically reports App Hangs. An App Hang is captured when the main thread is blocked for more than 3 seconds. App Hangs that last more than 3 seconds are considered severe and are likely to cause user frustration. They are reported along with a stack trace for debugging.
Warning
Crash reporting will not function correctly if the device is connected to Xcode. When it is, Xcode catches all exceptions and they will not be sent to your dashboard.
Manual Crash Reporting
You can offer your users Instabug Bug Reporting to report bugs. However, you can use the following method and API to manually report any error or exception that you handle in your code and assign it a severity level.
You can now choose between two modes for the stack trace when reporting manual exceptions and errors: Full stack trace and Current thread only.
Full Stack Trace
The default mode for stack trace reporting is Full stack trace, which provides a complete stack trace for the error, including information about all threads. This mode is useful when you need to identify the exact cause of the error, as it provides a detailed view of the code execution flow.
Current Thread Only
The new mode for stack trace reporting is the Current thread only, which provides a stack trace for the current thread only. This mode is useful when you need to optimize the performance of their application, as it provides a lighter-weight option for reporting errors.
Report Exception
To report exceptions manually, use the following methods:
let exception = NSException(name: NSExceptionName("some_exception"), reason: "Exception reason")
if let nonFatalException = CrashReporting.exception(exception) {
	nonFatalException.stackTraceMode = .full
    nonFatalException.report()

}
NSException *exception = [NSException exceptionWithName:@"some_exception" reason:@"Exception reason" userInfo:nil];
IBGNonFatalException *nonFatalException = [IBGCrashReporting exception:exception];
nonFatalException.stackTraceMode = IBGNonFatalStackTraceModeFull;
[nonFatalException report];
Report Error
To report errors manually, use the following methods:
if let nonFatal = CrashReporting.error(error) {
    nonFatal.stackTraceMode = .full
    nonFatal.report()
}
NSError *error = [[NSError alloc] initWithDomain:@"Domain" code:0 userInfo:nil];
IBGNonFatalError *nonFatal = [IBGCrashReporting error:error];
nonFatal.stackTraceMode = IBGNonFatalStackTraceModeFull;
[nonFatal report];
Adding Levels to Exception & Errors
You can set different levels for manually reported exceptions using the following API:
Exceptions
let exception = NSException(name: NSExceptionName("some_exception"), reason: "Exception reason")
if let nonFatalException = CrashReporting.exception(exception) {
    nonFatalException.userAttributes = [
      "hello" : "world"
    ]
    nonFatalException.groupingString = "com.service.method.some_exception"
    nonFatalException.level = .critical
    nonFatalException.report()
}
NSException *exception = [NSException exceptionWithName:@"some_exception" reason:@"Exception reason" userInfo:nil];
IBGNonFatalException *nonFatalException = [IBGCrashReporting exception:exception];
nonFatalException.userAttributes = @{
    @"hello" : @"world"
};
nonFatalException.groupingString = @"com.service.method.some_exception";
nonFatalException.level = IBGNonFatalLevelWarning;
[nonFatalException report];
Errors
let exception = NSException(name: NSExceptionName("some_exception"), reason: "Exception reason")
if let nonFatalException = CrashReporting.exception(exception) {
    nonFatalException.userAttributes = [
      "hello" : "world"
    ]
    nonFatalException.groupingString = "com.service.method.some_exception"
    nonFatalException.level = .critical
    nonFatalException.report()
}
NSException *exception = [NSException exceptionWithName:@"some_exception" reason:@"Exception reason" userInfo:nil];
IBGNonFatalException *nonFatalException = [IBGCrashReporting exception:exception];
nonFatalException.userAttributes = @{
    @"hello" : @"world"
};
nonFatalException.groupingString = @"com.service.method.some_exception";
nonFatalException.level = IBGNonFatalLevelWarning;
[nonFatalException report];
Severity Levels
Here are the different severity levels available for exceptions and errors. In case no level is indicated, the default level would be error.
warning
error
critical
info
IBGNonFatalLevelWarning
IBGNonFatalLevelError
IBGNonFatalLevelCritical
IBGNonFatalLevelInfo
Performance Improvement
On average, it takes 5ms less to capture a stack trace while using
CallerThread.
Modifying Stacktraces for Handled Errors
If you use a wrapper function to send handled errors, you can trim the wrapper function from the event’s stack trace. This will help you in having a more readable stacktrace.
if let nonFatal = CrashReporting.error(error) {
    nonFatal.stackFramesToTrim = 2
    nonFatal.report()
}
NSError *error = [[NSError alloc] initWithDomain:@"Domain" code:0 userInfo:nil];
IBGNonFatalError *nonFatal = [IBGCrashReporting error:error];
nonFatal.stackFramesToTrim = 2;
[nonFatal report];
Grouping
When an already existing crash occurs once more for any user, that crash is reported as an occurrence in the original entry. However, in order to calculate whether a crash already exists and needs to be grouped, Instabug generates a fingerprint based on attributes used in the grouping logic.
The default Instabug grouping algorithm uses a mix of the exception and stack trace information. In some cases, you might want to change how the issues are grouped together using custom grouping or fingerprints.
Custom Grouping
Required dSYM Files
Please note that in order for custom grouping to be applied, dSYM files are required to be uploaded first; otherwise, default grouping will be applied. For more information on uploading dSYM files, please visit the symbolication page.
One way to customize how crashes are grouped together is by providing Instabug with packages that you would like us to ignore from our default grouping logic. If you define a package to be ignored, Instabug will skip the frame with that package and move on to find the next one that is not on your ignored list. This is done on an application level by going to your Application → Settings → Custom Crash Grouping.
Expected Input:
- Path
- Binary Image
Paths will be evaluated on a starts with basis, while Binary Images will be evaluated on an equality basis.
Examples:
-
Path =
Instabug
-- Ignores =Instabug,Instabug/CrashReporting,Instabug/APM -
Path =
Instabug/APM
-- Ignores =Instabug/APM,Instabug/APM/AppLaunch
-- Doesn't Ignore =Instabug,Instabug/CrashReporting -
Binary Image =
BinaryImage
-- Ignores =BinaryImage
-- Doesn't Ignore =BinaryImage2,Binaryimage
Sample Stack Trace:
libobic.A.dylib    foreach_realized_class(bool (objc_class*) block_pointer) + 123

CoreFoundation.    -__NSSingleObjectArraylenumerateObjectsWithOptions:usingBlock:] + 11

ThirdParty         -[LoggerManager LogArray:] + 80

Myapp              - ViewController tableView:didSelectRowAtindexPath:
UIKitCore          -[UIKBUndoStateHUD initWithKeyboardAppearance:] + 4171
Myapp              _main
-
Without custom grouping, Instabug would group the crash based on
ThirdParty -[LoggerManager LogArray:] + 80since it's the first non-system frame -
With custom grouping while ignoring path
home/files/ThirdParty/and binary imageThirdParty, we will skip the first frameThirdParty -[LoggerManager LogArray:] + 80, and the crash will be grouped based onMyapp - ViewController tableView:didSelectRowAtindexPath:.
Custom Fingerprinting
Overriding the default grouping
Please note that using custom fingerprinting will override Instabug's default grouping by sending a fingerprint string.
In the event that you'd like to report the exception manually with a custom grouping fingerprint in mind, you can use the below APIs to do just that.
CrashReporting.reportError(error, withGroupingString: "grouping string")
CrashReporting.report(exception, withGroupingString: "grouping string")
[IBGCrashReporting reportException:exception groupingString:@"grouping string"];
[IBGCrashReporting reportError:error groupingString:@"grouping string"];
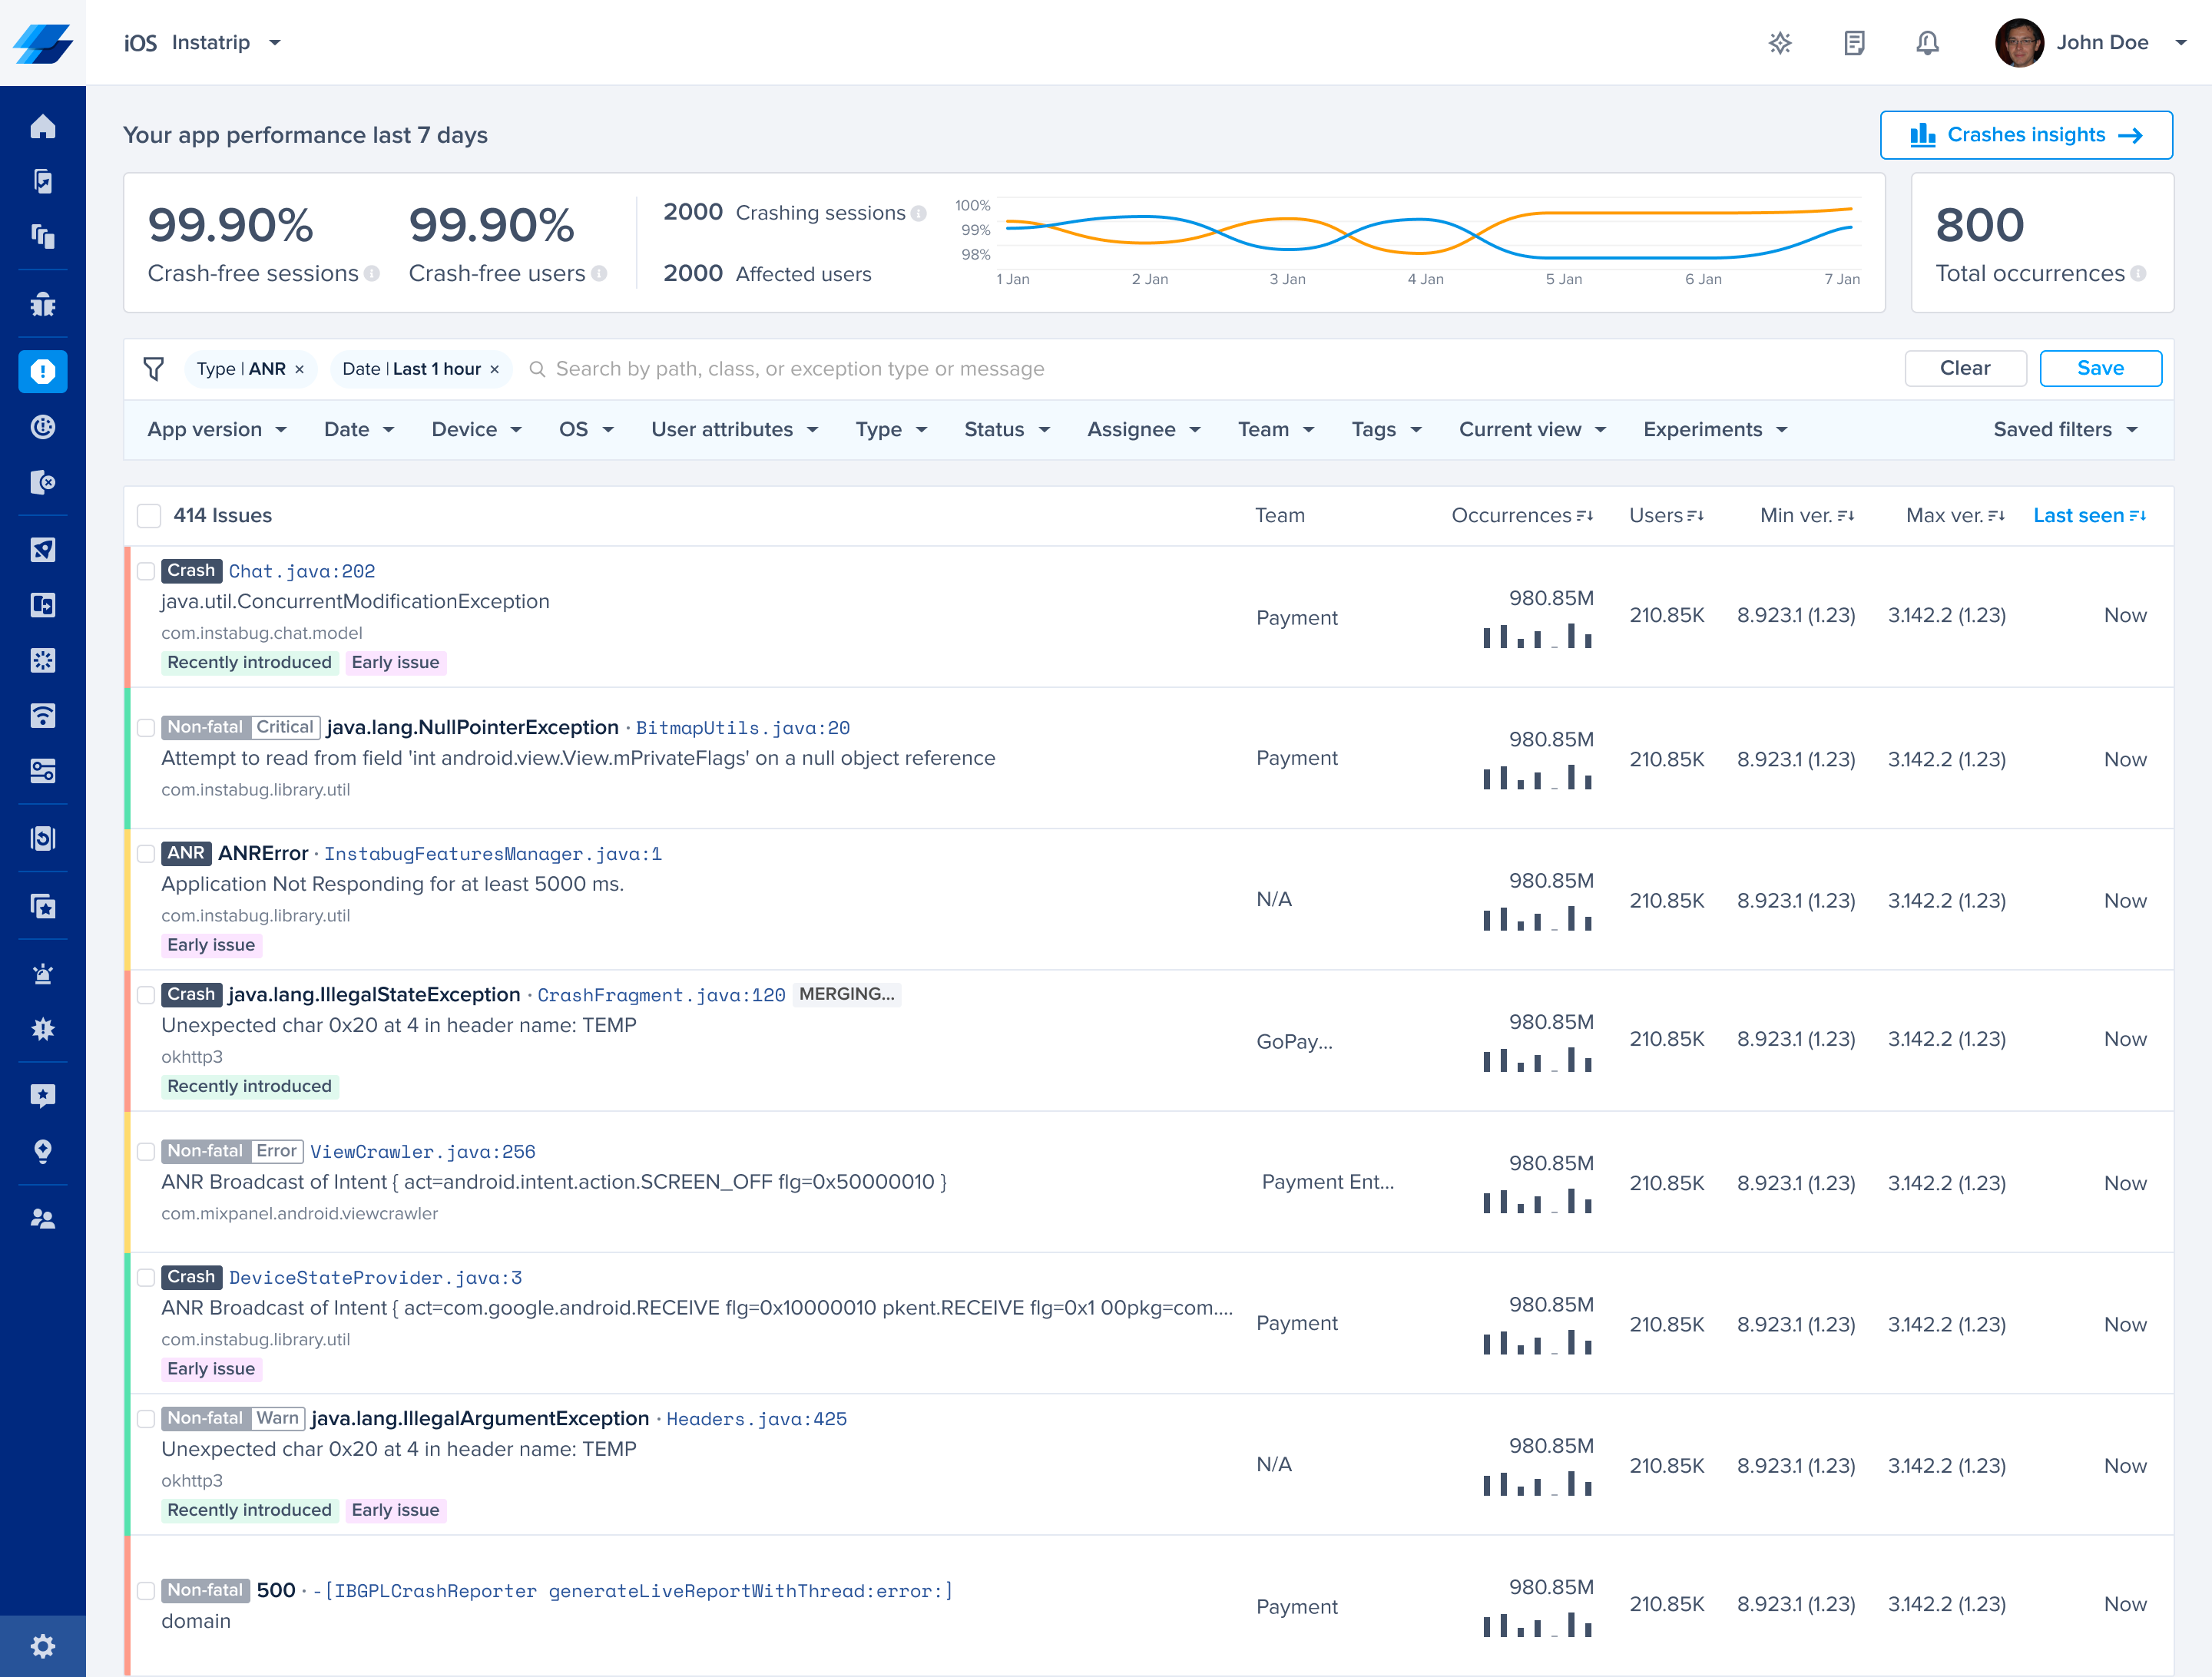
Crashes List
This section contains a list of all the crashes that have been reported by your application. The title of each crash is usually the most significant line in the stack trace.
.png")
An example of the list of crashes in the crashes page of the Instabug dashboard.
Next to each crash in the list, you can find the following details, all of which can be used to sort the crashes:
- Occurrences: The number of times this crash has occurred and a bar graph representing its occurrences over the past seven days.
- Users: The number of users affected by this crash.
- Min ver.: The oldest app version that was affected by this crash.
- Max ver.: The latest app version that was affected by this crash.
- Last seen: The last time an occurrence of this crash was reported.
You can then filter for crashes that match any of the following criteria:
- App version
- Date
- Device
- OS
- User attributes
- Type
- Status
- Assignee
- Team
- Tags
- Current view
- Experiments
Updated 10 months ago