
Grafana End to End Tracing
Overview
The new Instabug integration with Grafana enables end-to-end tracing for network calls, connecting client-side and server-side monitoring for your network requests. By using a unique trace ID, you can follow any network request from the client to the server, providing insights for troubleshooting networking issues.
Prerequisites
- Backend
- Agent Supporting W3C Context Propagation: Ensure your backend agent supports W3C context propagation.
Note: If you use any trace sampling algorithms, Grafana may drop some traces. Consequently, you might see network requests in Instabug that are not available in Grafana.
- Instabug's Side
- Supported Platforms: This integration is only supported for iOS and Android.
- Instabug SDK Version: Ensure you have Instabug SDK version 13.2.0 or higher for both iOS and Android.
- If you are manually logging the network they need to:
- Either send the
httpUrlConnectionor make sure you send all headers in the request - If you are masking the headers, make sure you don't remove the
traceparentheader
- Either send the
Integration Steps
By setting up this integration, Instabug will attach a trace ID as an HTTP header to your network requests. This allows us to link network requests from Instabug to Grafana.
- To create a Grafana Integration go to Settings -> Integrations -> Grafana in your Instabug dashboard.
- Setup
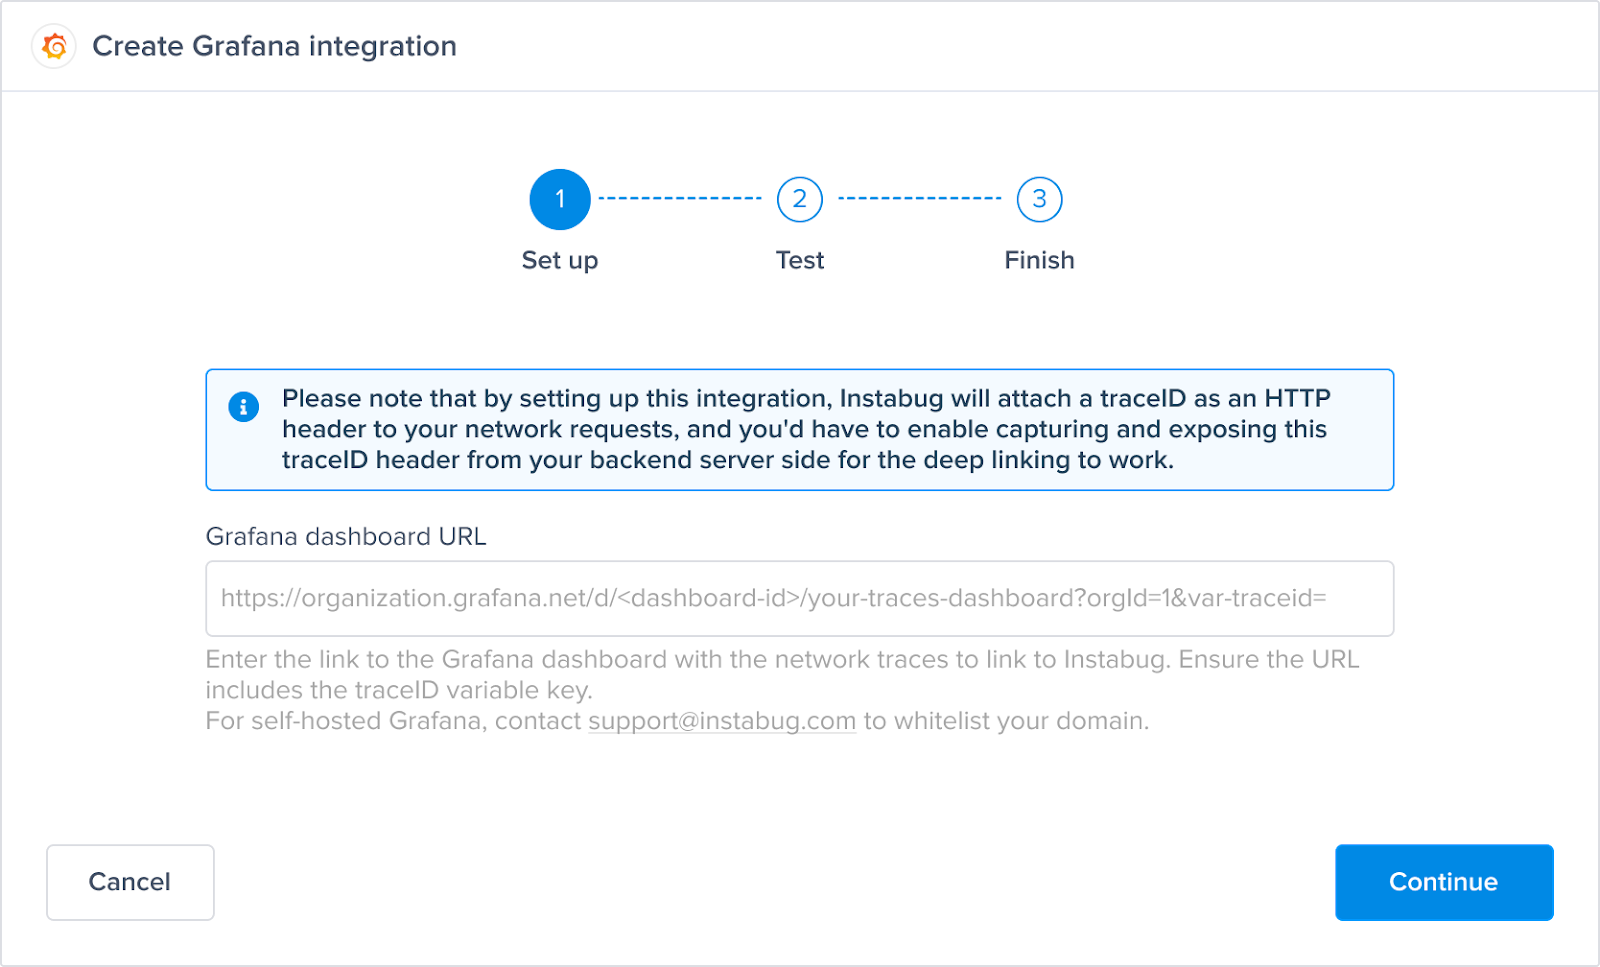
- Enter the link to the Grafana dashboard with the network traces to link to Instabug.
- Create a
traceIDvariable in that Grafana dashboard, and ensure the URL includes thetraceIDvariable key at the end. - For example:
https://organization.grafana.net/d/<dashboard-id>/your-traces-dashboard?orgId=1&var-traceid= - For self-hosted Grafana, contact [email protected] to whitelist your domain.
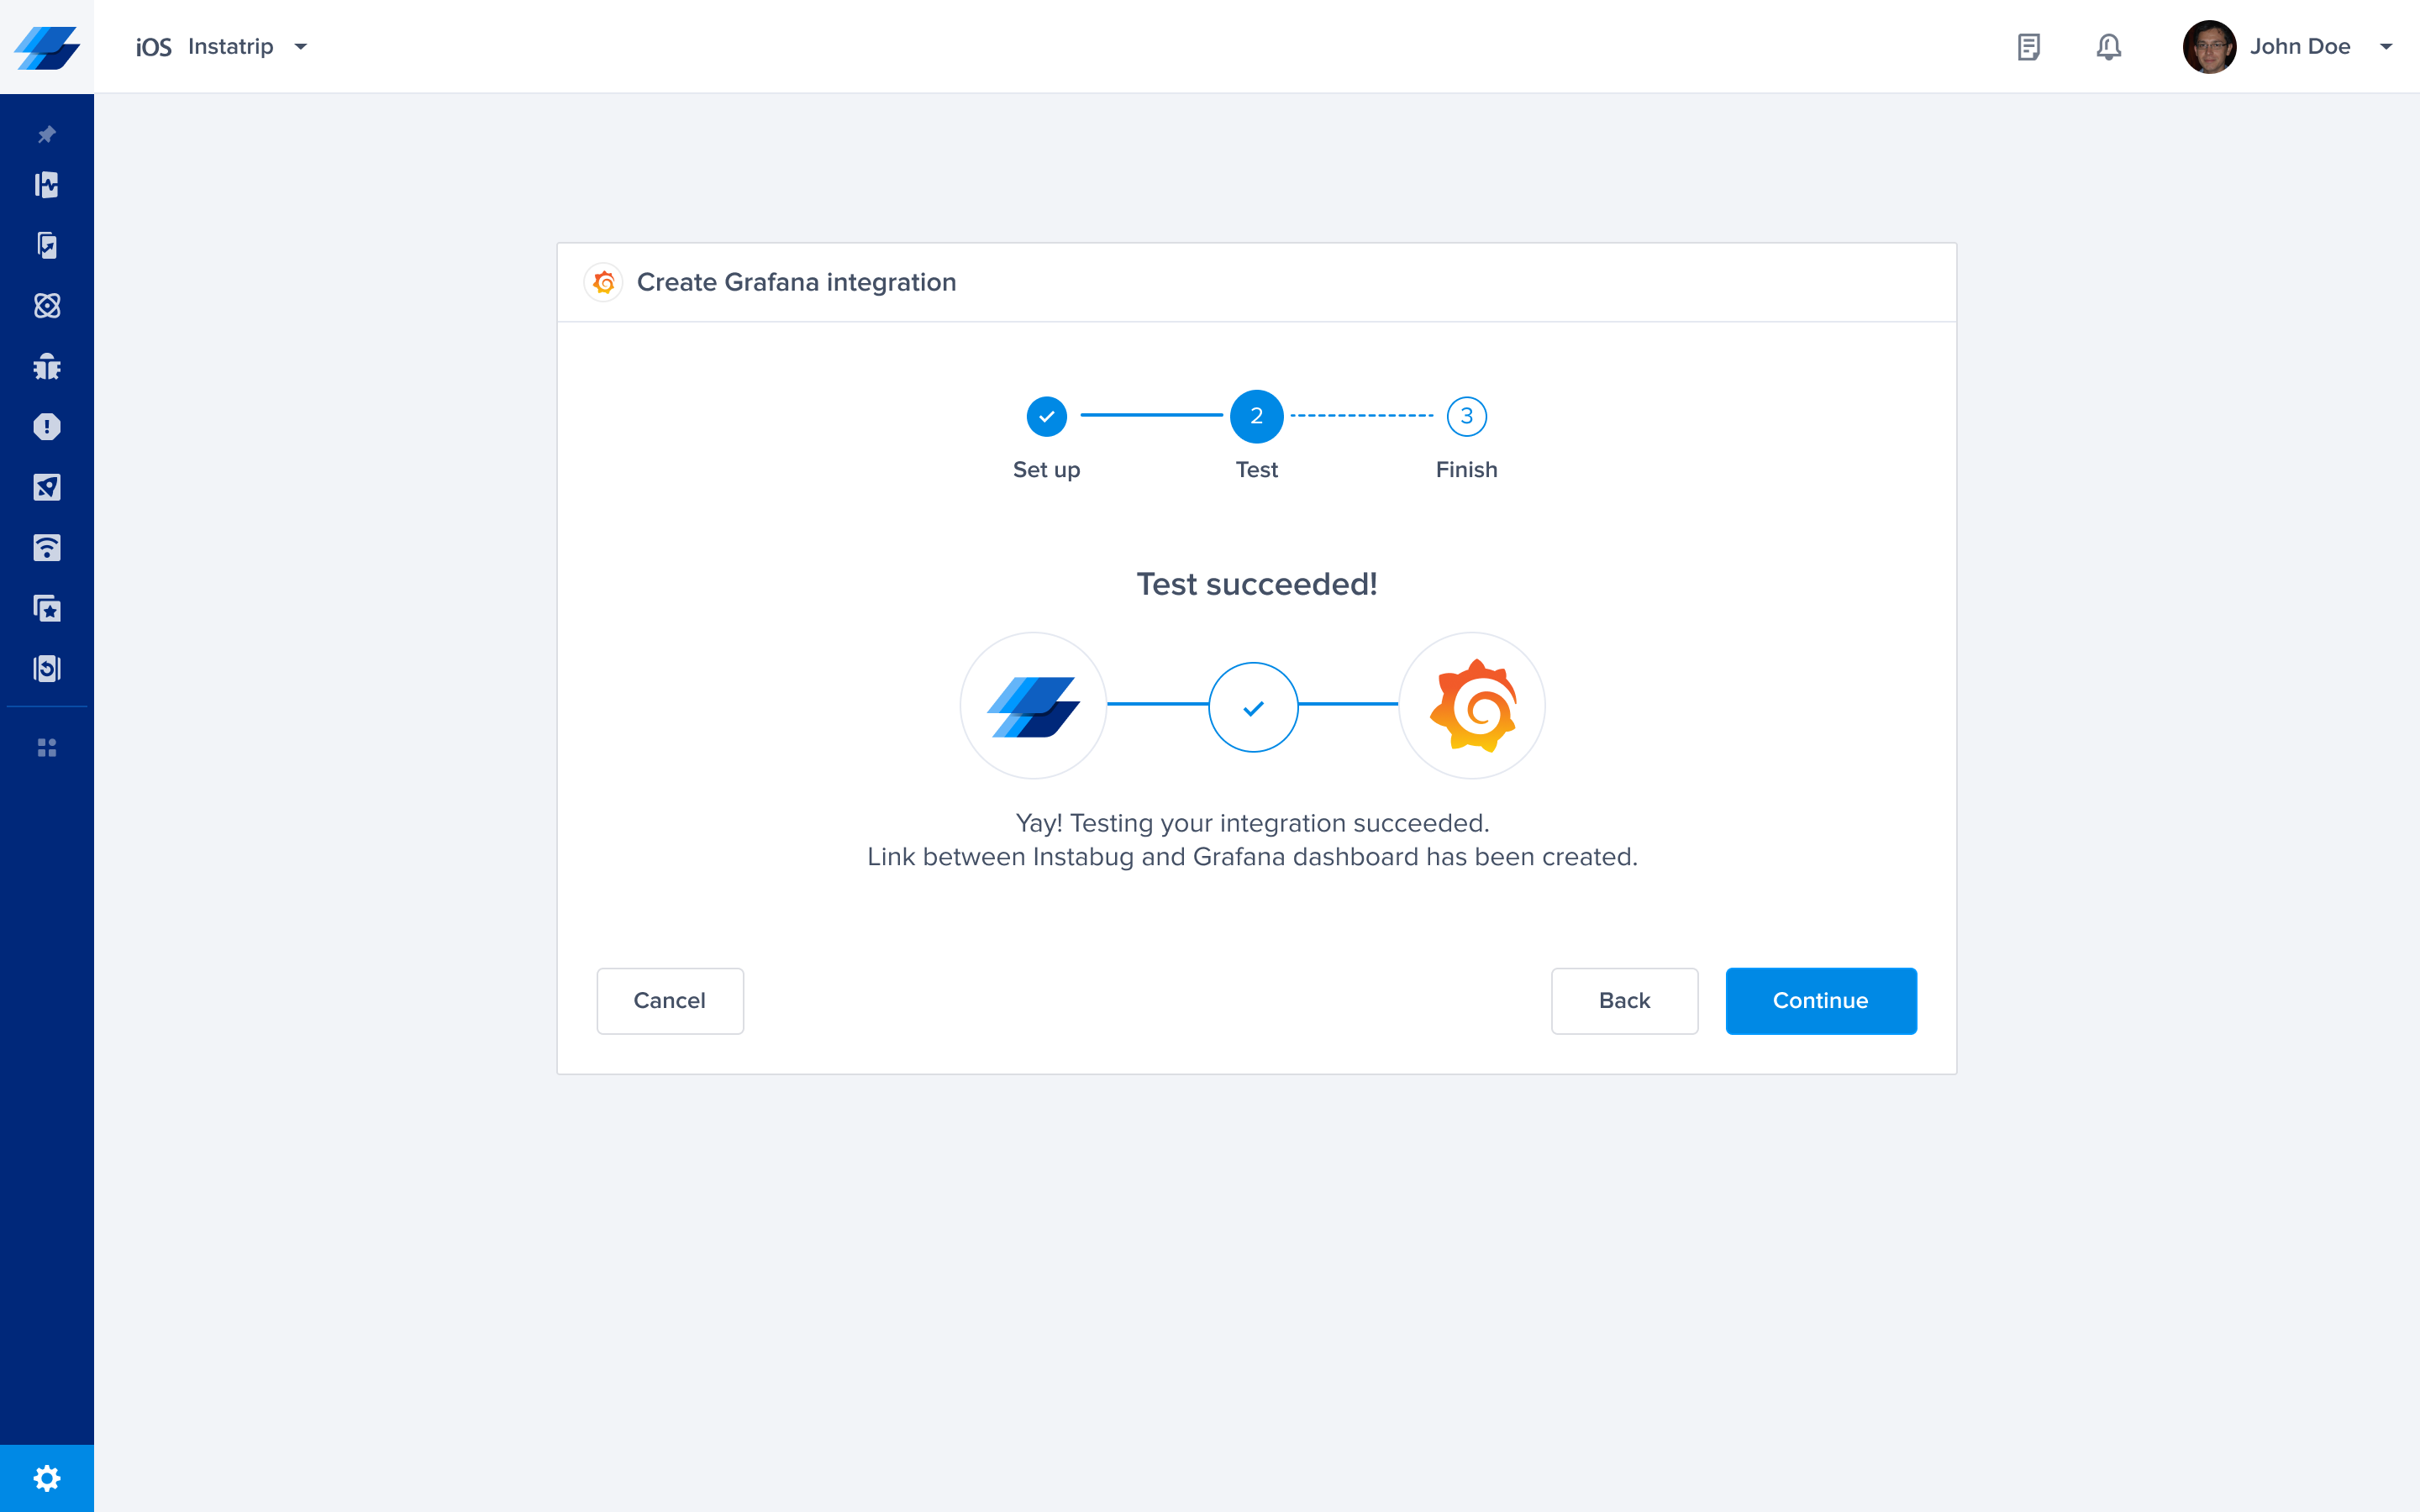
- Test:
- Validate the Grafana dashboard link to ensure it is correct.
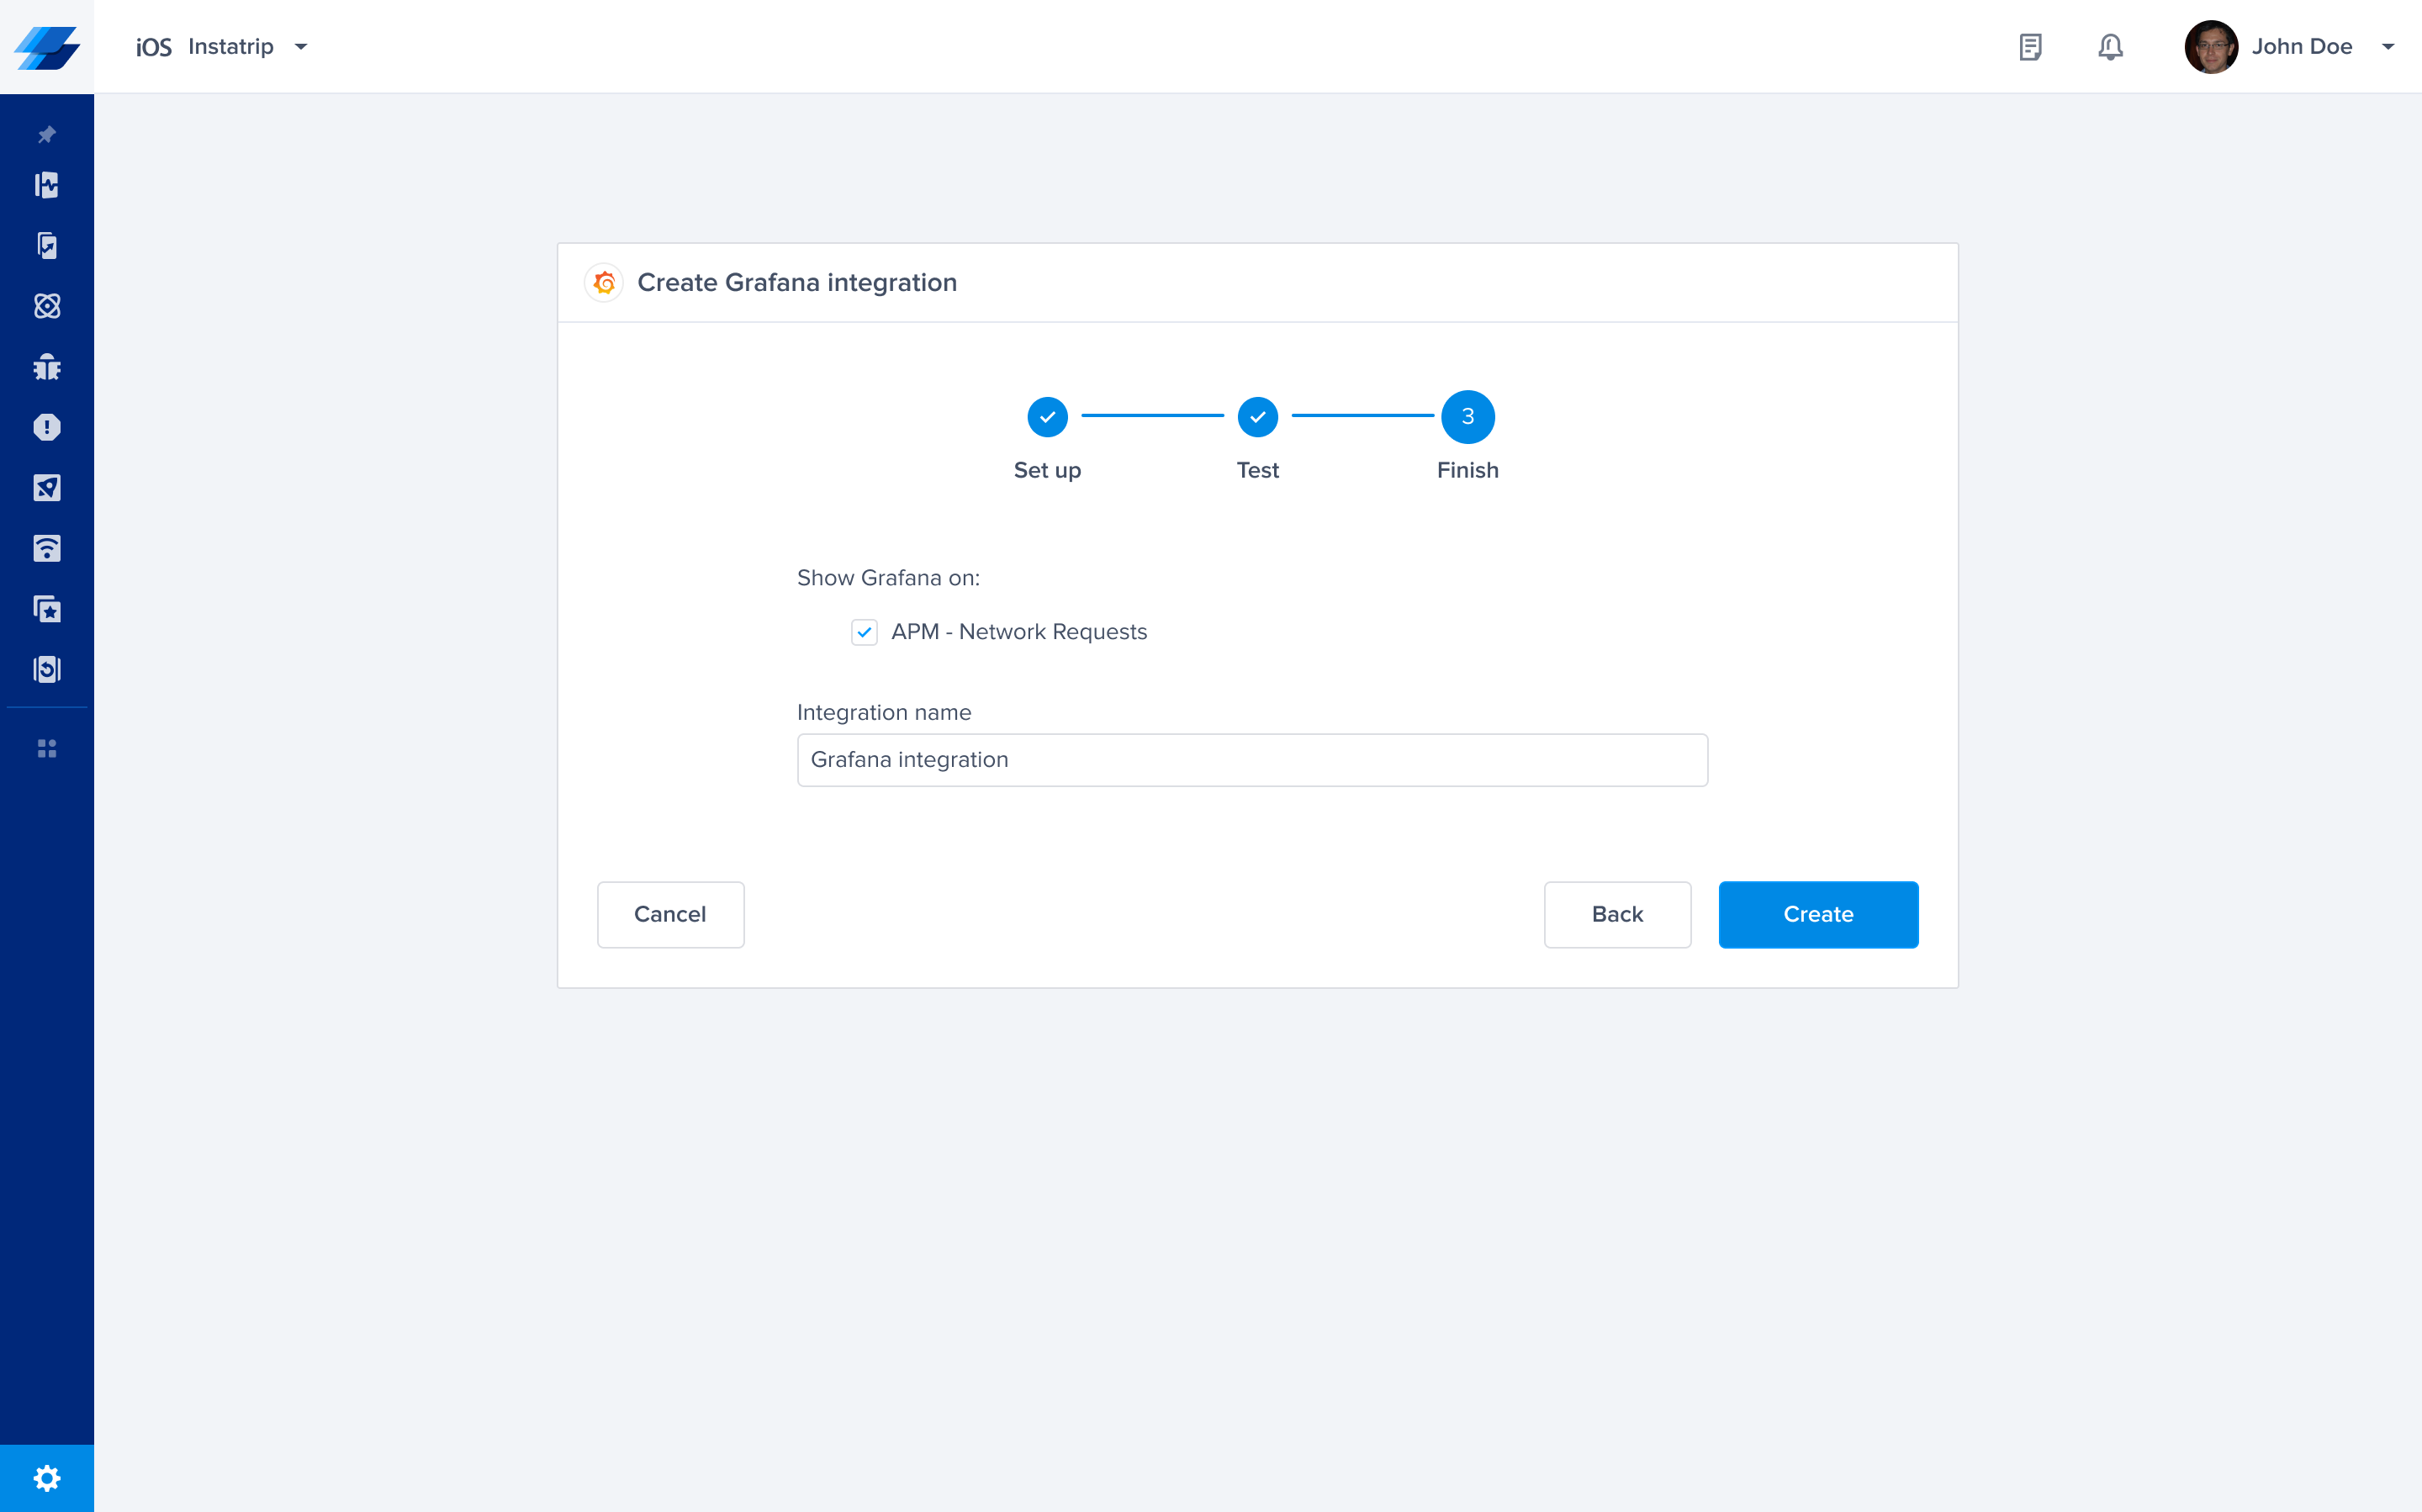
- Finish:
- Ensure the APM - Network Requests checkbox is checked to trace network requests to Grafana.
- Give your integration a name and save the integration.
Using the Integration
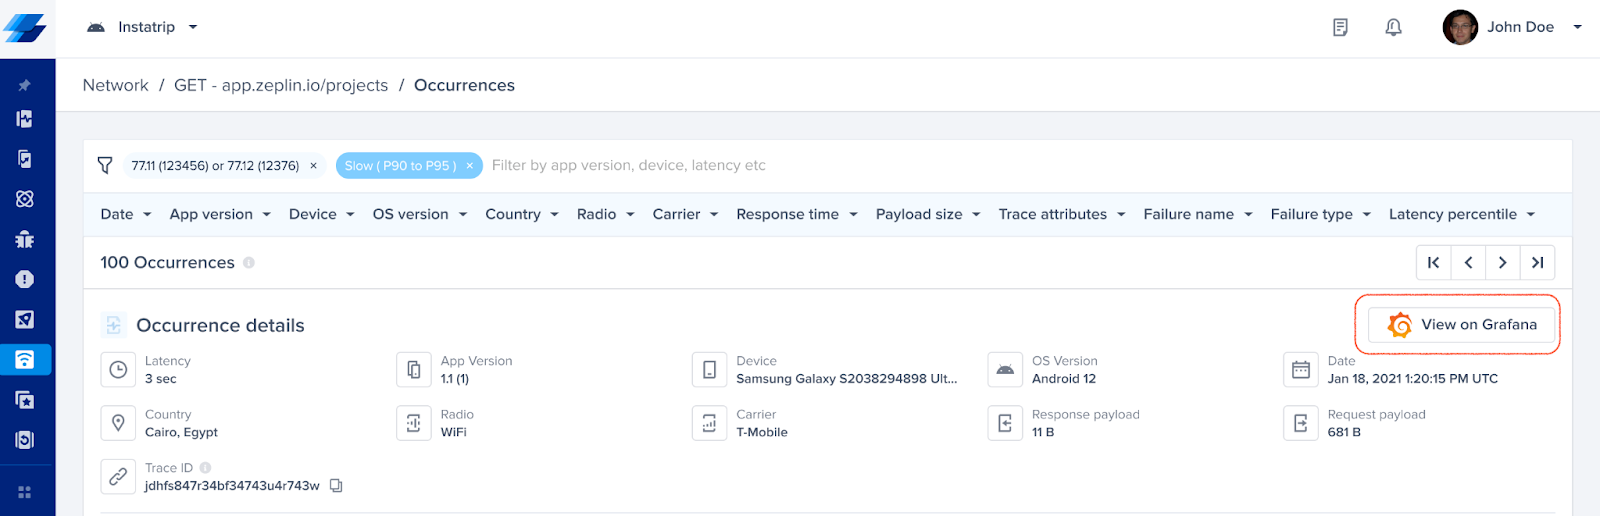
When a network occurrence is logged, a unique trace ID will appear on the occurrence page in the Instabug dashboard.
- Navigate to a network occurrence in Instabug.
- Click on View on Grafana to verify that it redirects you to the correct Grafana dashboard, filtered by the
TraceID.

Updated 7 months ago