
App Health Dashboard
A comprehensive overview of your application's performance, stability, and overall quality.
Overview
The App Health Dashboard provides a comprehensive overview of your application's performance, stability, and overall quality. With five key sections, this dashboard is designed to give you detailed insights into the state of your app, helping you to monitor and improve its quality and user satisfaction.
Benefits
- Comprehensive Monitoring: Get a holistic view of your app’s performance and user experience.
- Performance Trends: Track how your app's performance changes over time.
- Detailed Insights: Identify specific areas that need improvement, from crash rates to UI responsiveness.
- User Feedback: Understand user satisfaction through ratings and reviews.
- Release Analysis: Evaluate the impact of new releases on app performance and user experience.
Usage Tips
- Regularly monitor the Frustration-Free Sessions and Crash-Free Sessions to ensure high user satisfaction.
- Use the App Insights section to quickly identify and address performance issues by navigating to the worst performing metrics
- Zoom in on Frustration-Free Sessions drops to find the worst performing metics contributing to the drop in App Insights.
- Pay attention to App Ratings to gather qualitative feedback from users.
- Analyze the Top Releases section to understand the effects of recent updates and optimize future releases.
Key Sections
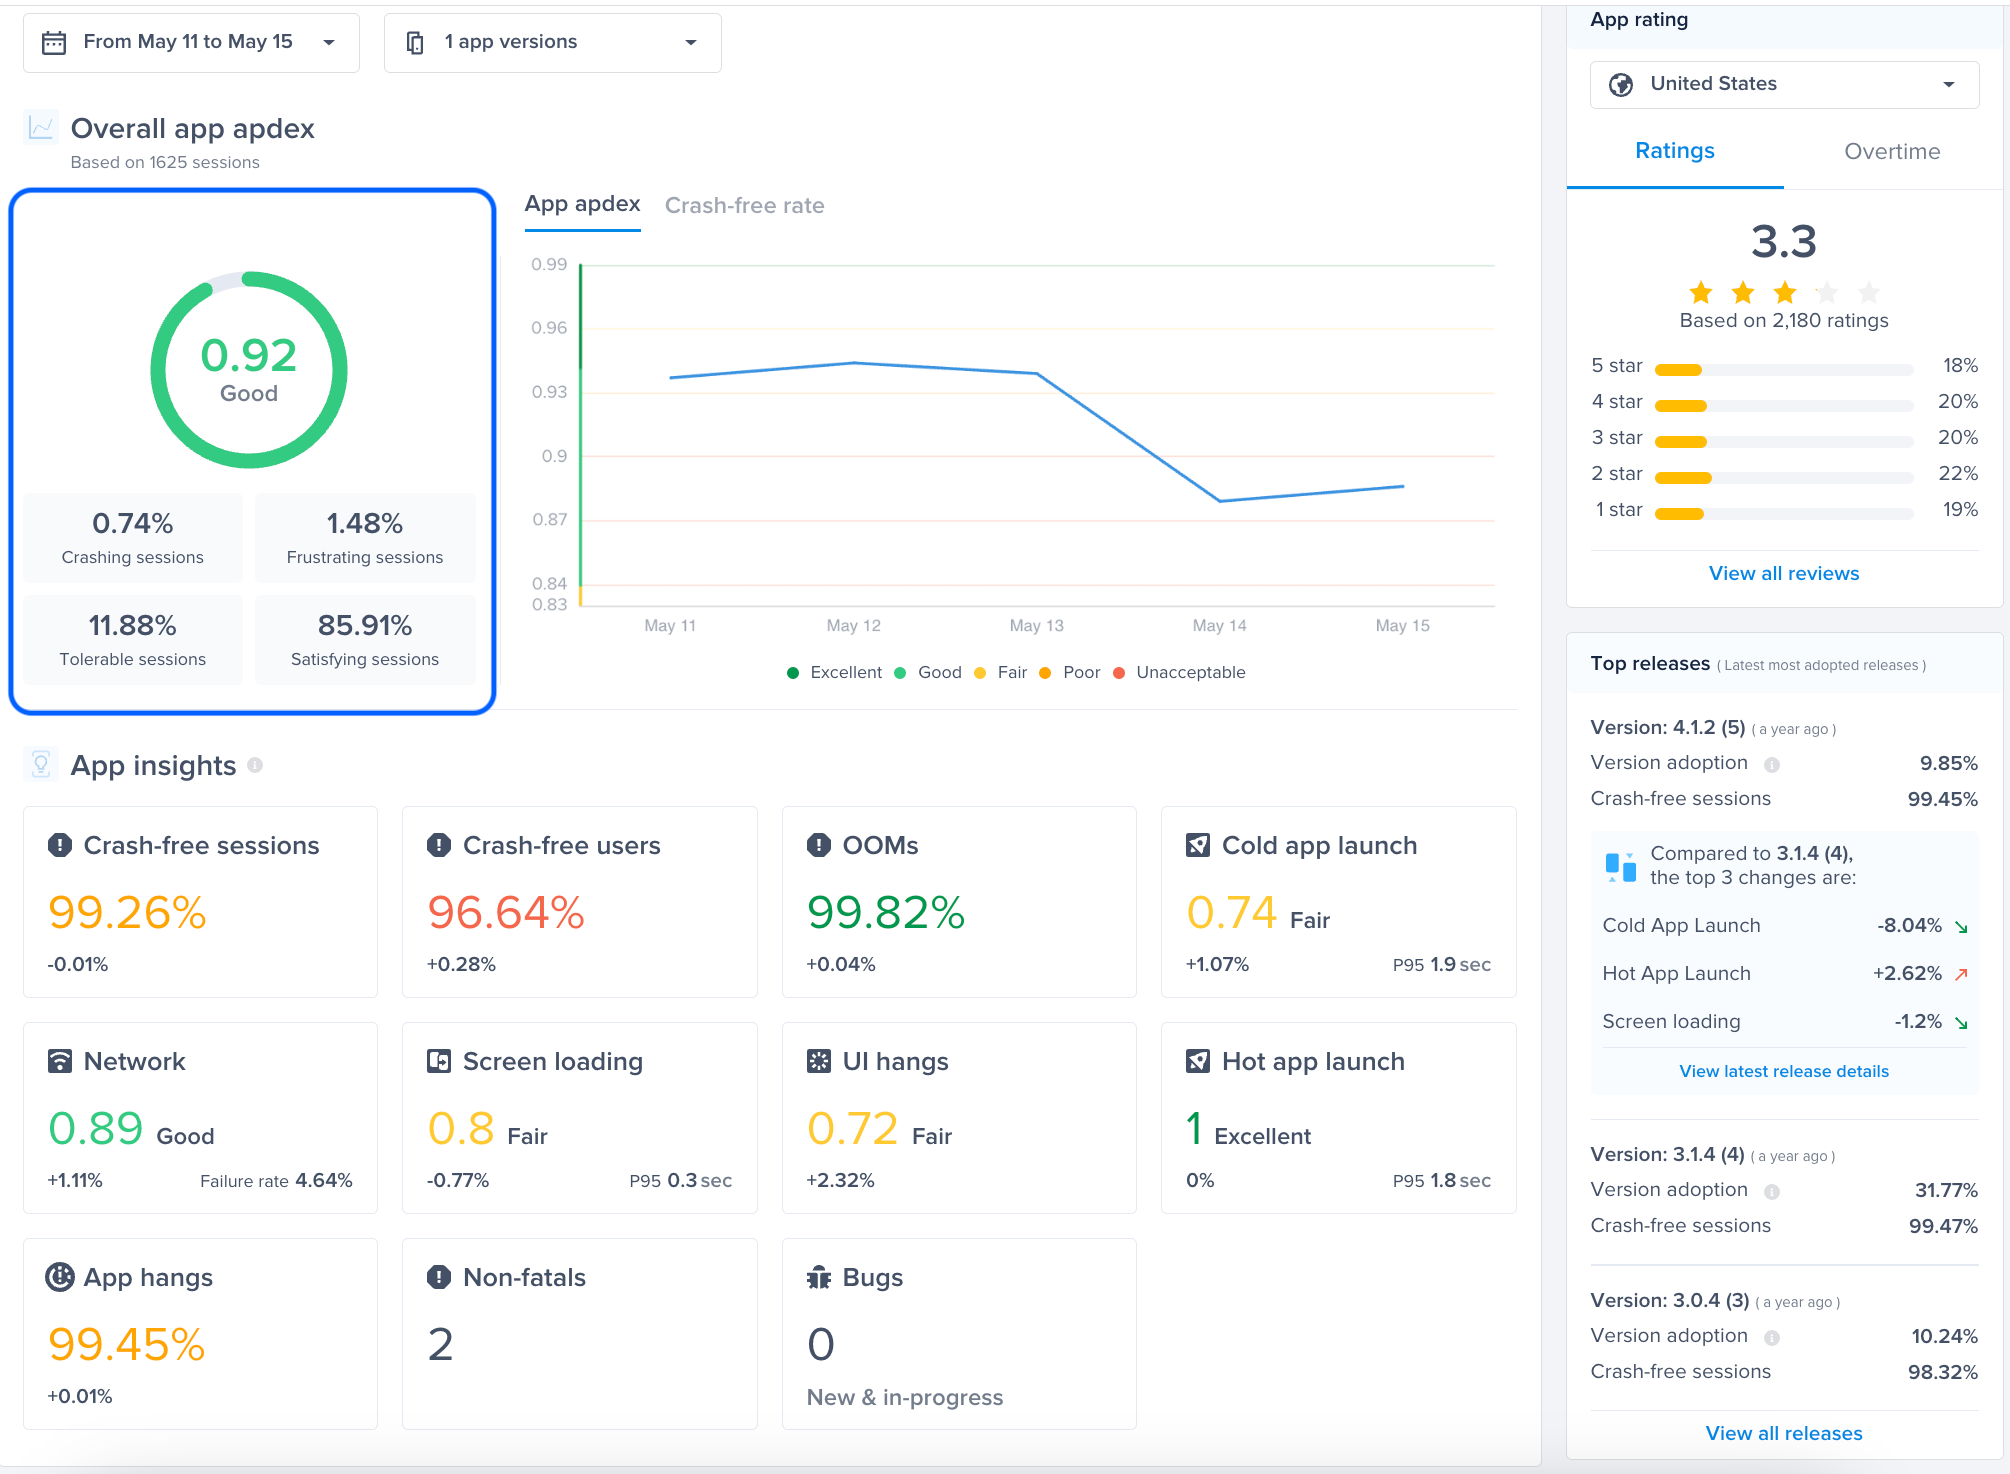
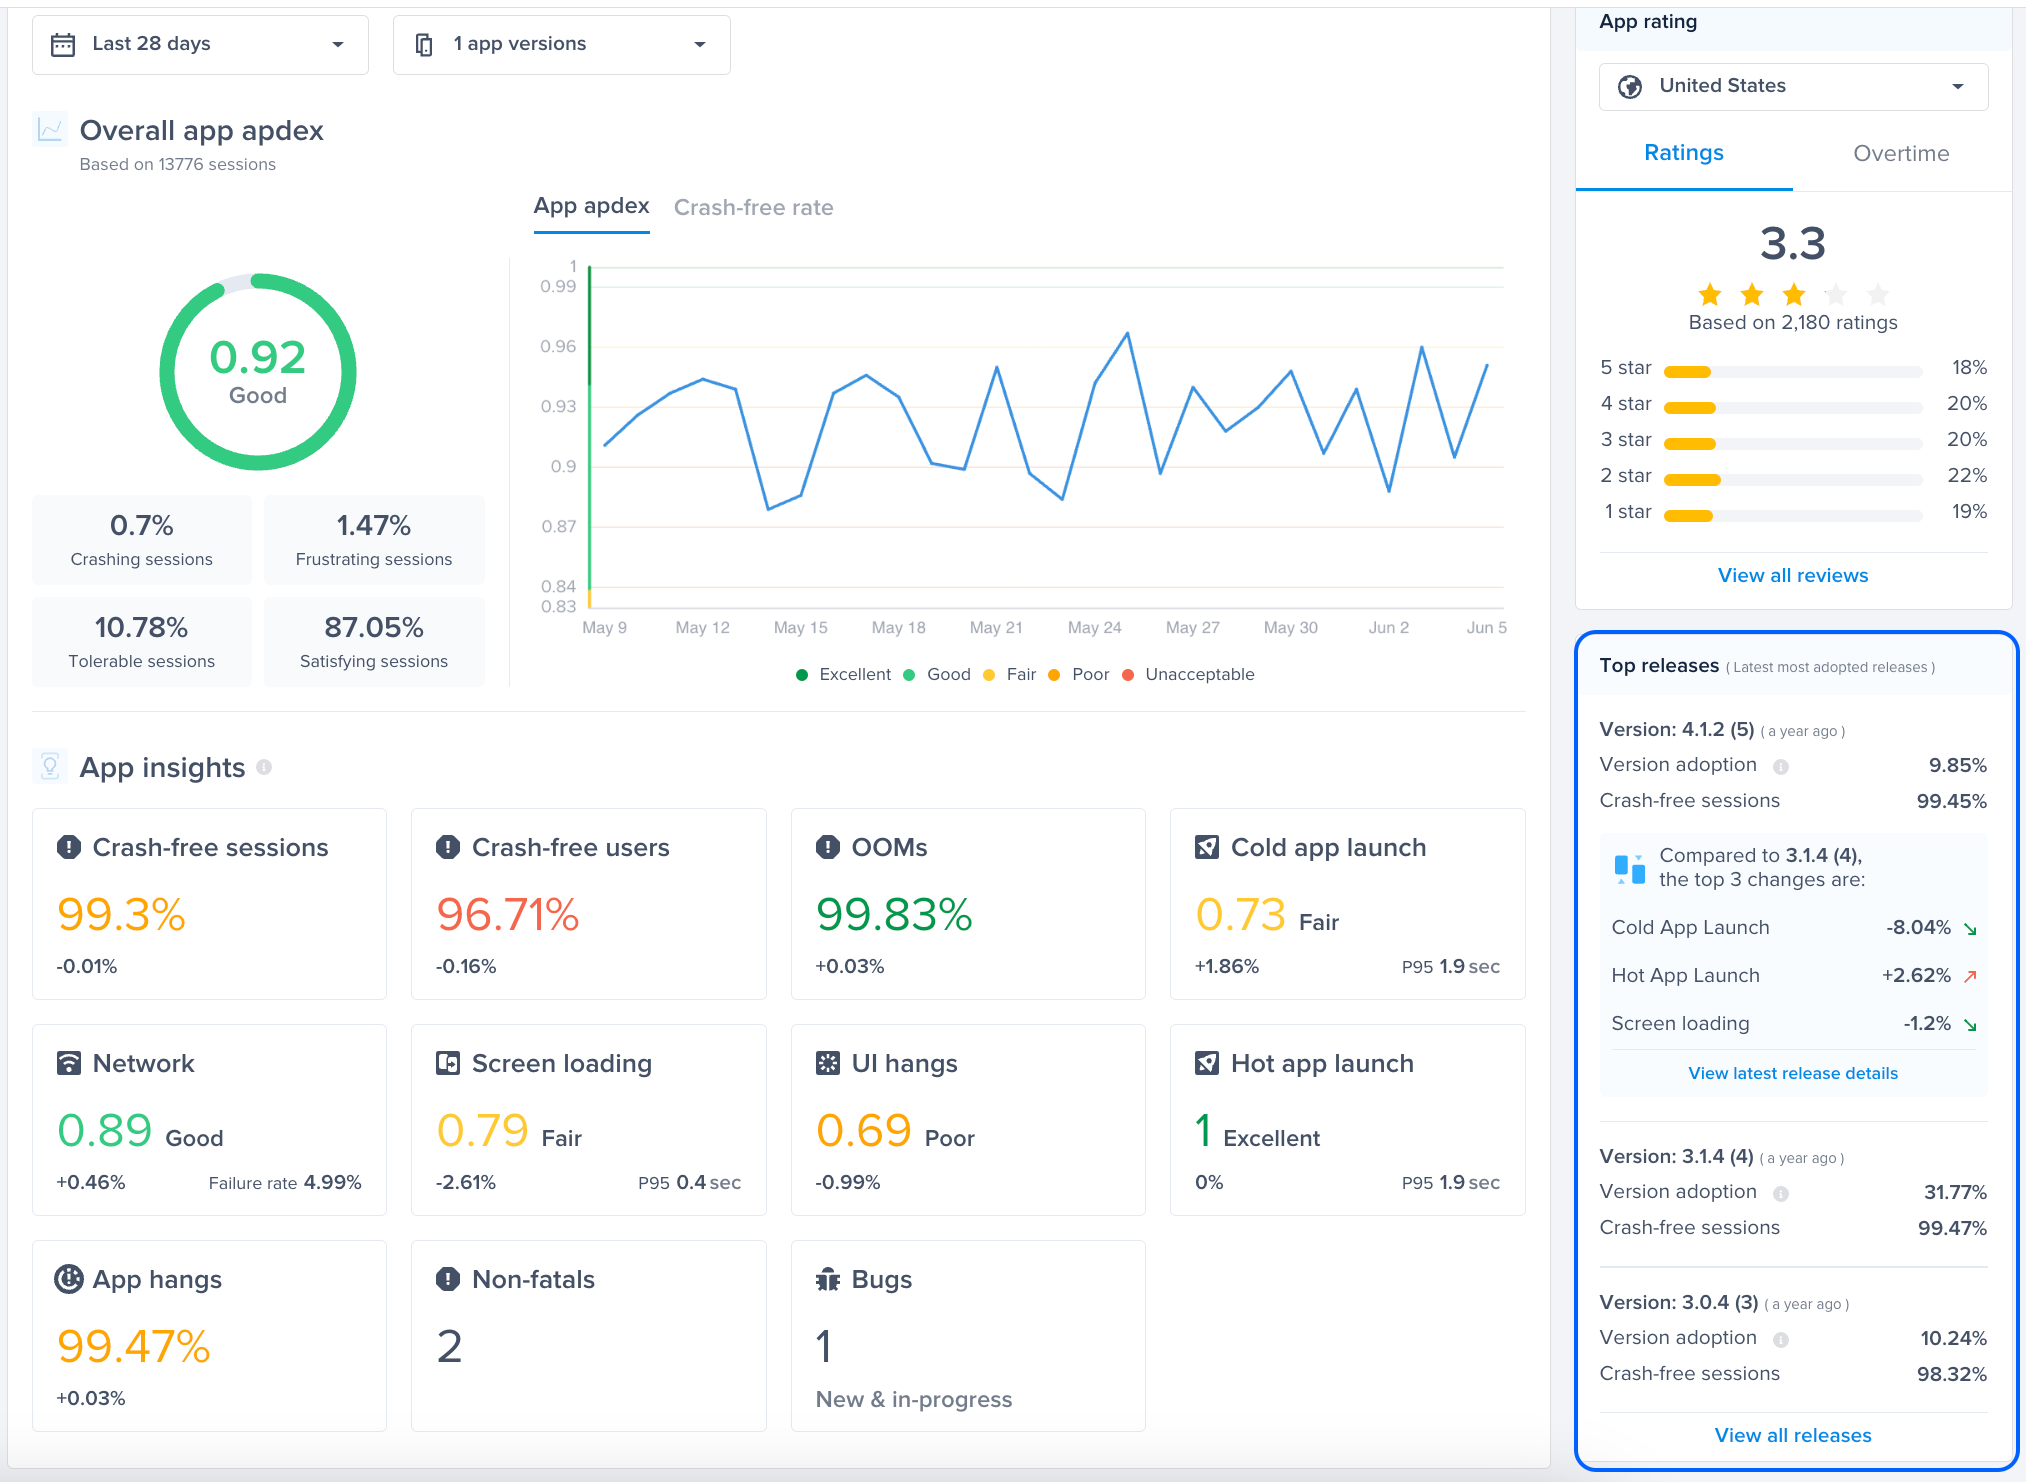
Overall Frustration-Free Sessions and Session Breakdown
-
Frustration-Free Sessions: The Frustration-Free Sessions metric is a numerical measure of user satisfaction with your app's performance.
-
Session Breakdown: This section categorizes user sessions into four types:
- Crashing Sessions: Sessions that ended due to app crashes.
- Frustrating Sessions: Sessions that were significantly impacted by performance issues.
- Tolerable Sessions: Sessions where users experienced minor performance issues.
- Satisfying Sessions: Sessions where users had a smooth experience.
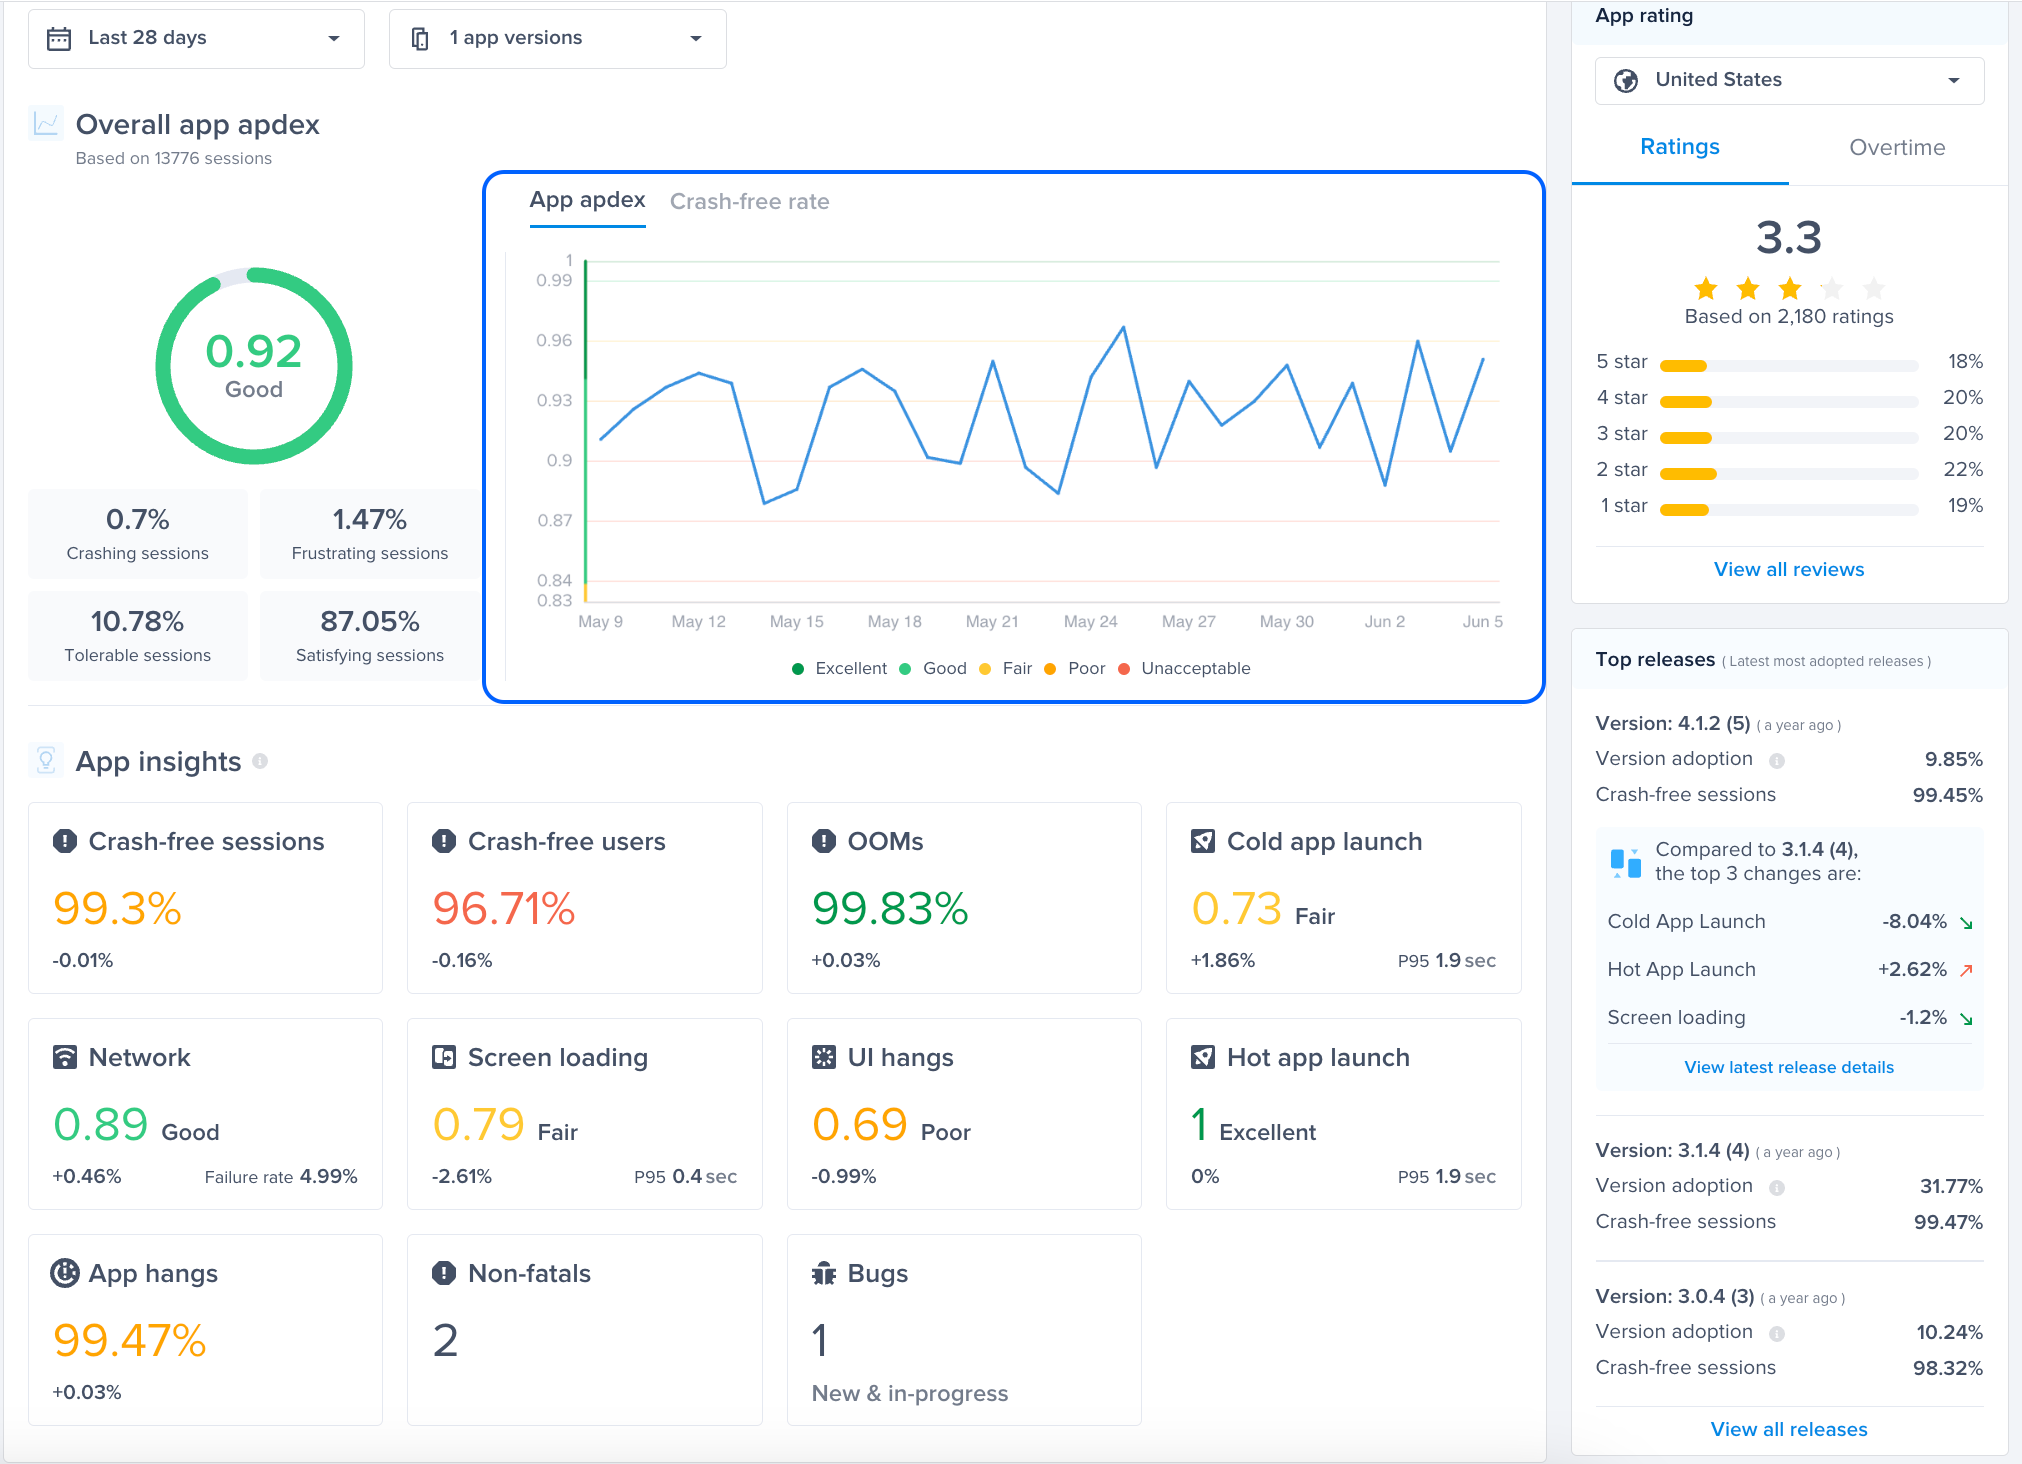
Frustration-Free Sessions and Crash-Free Sessions Over Time
This graph shows the trend of your app's frustration-free sessions and crash-free sessions over a selected period. The provided graph shows fluctuations in frustration-free sessions over a 28-day period, helping in identifying patterns and periods of performance degradation or improvement. You can click and drag on the graph to zoom in and the whole page will reflect the data of the new time range.
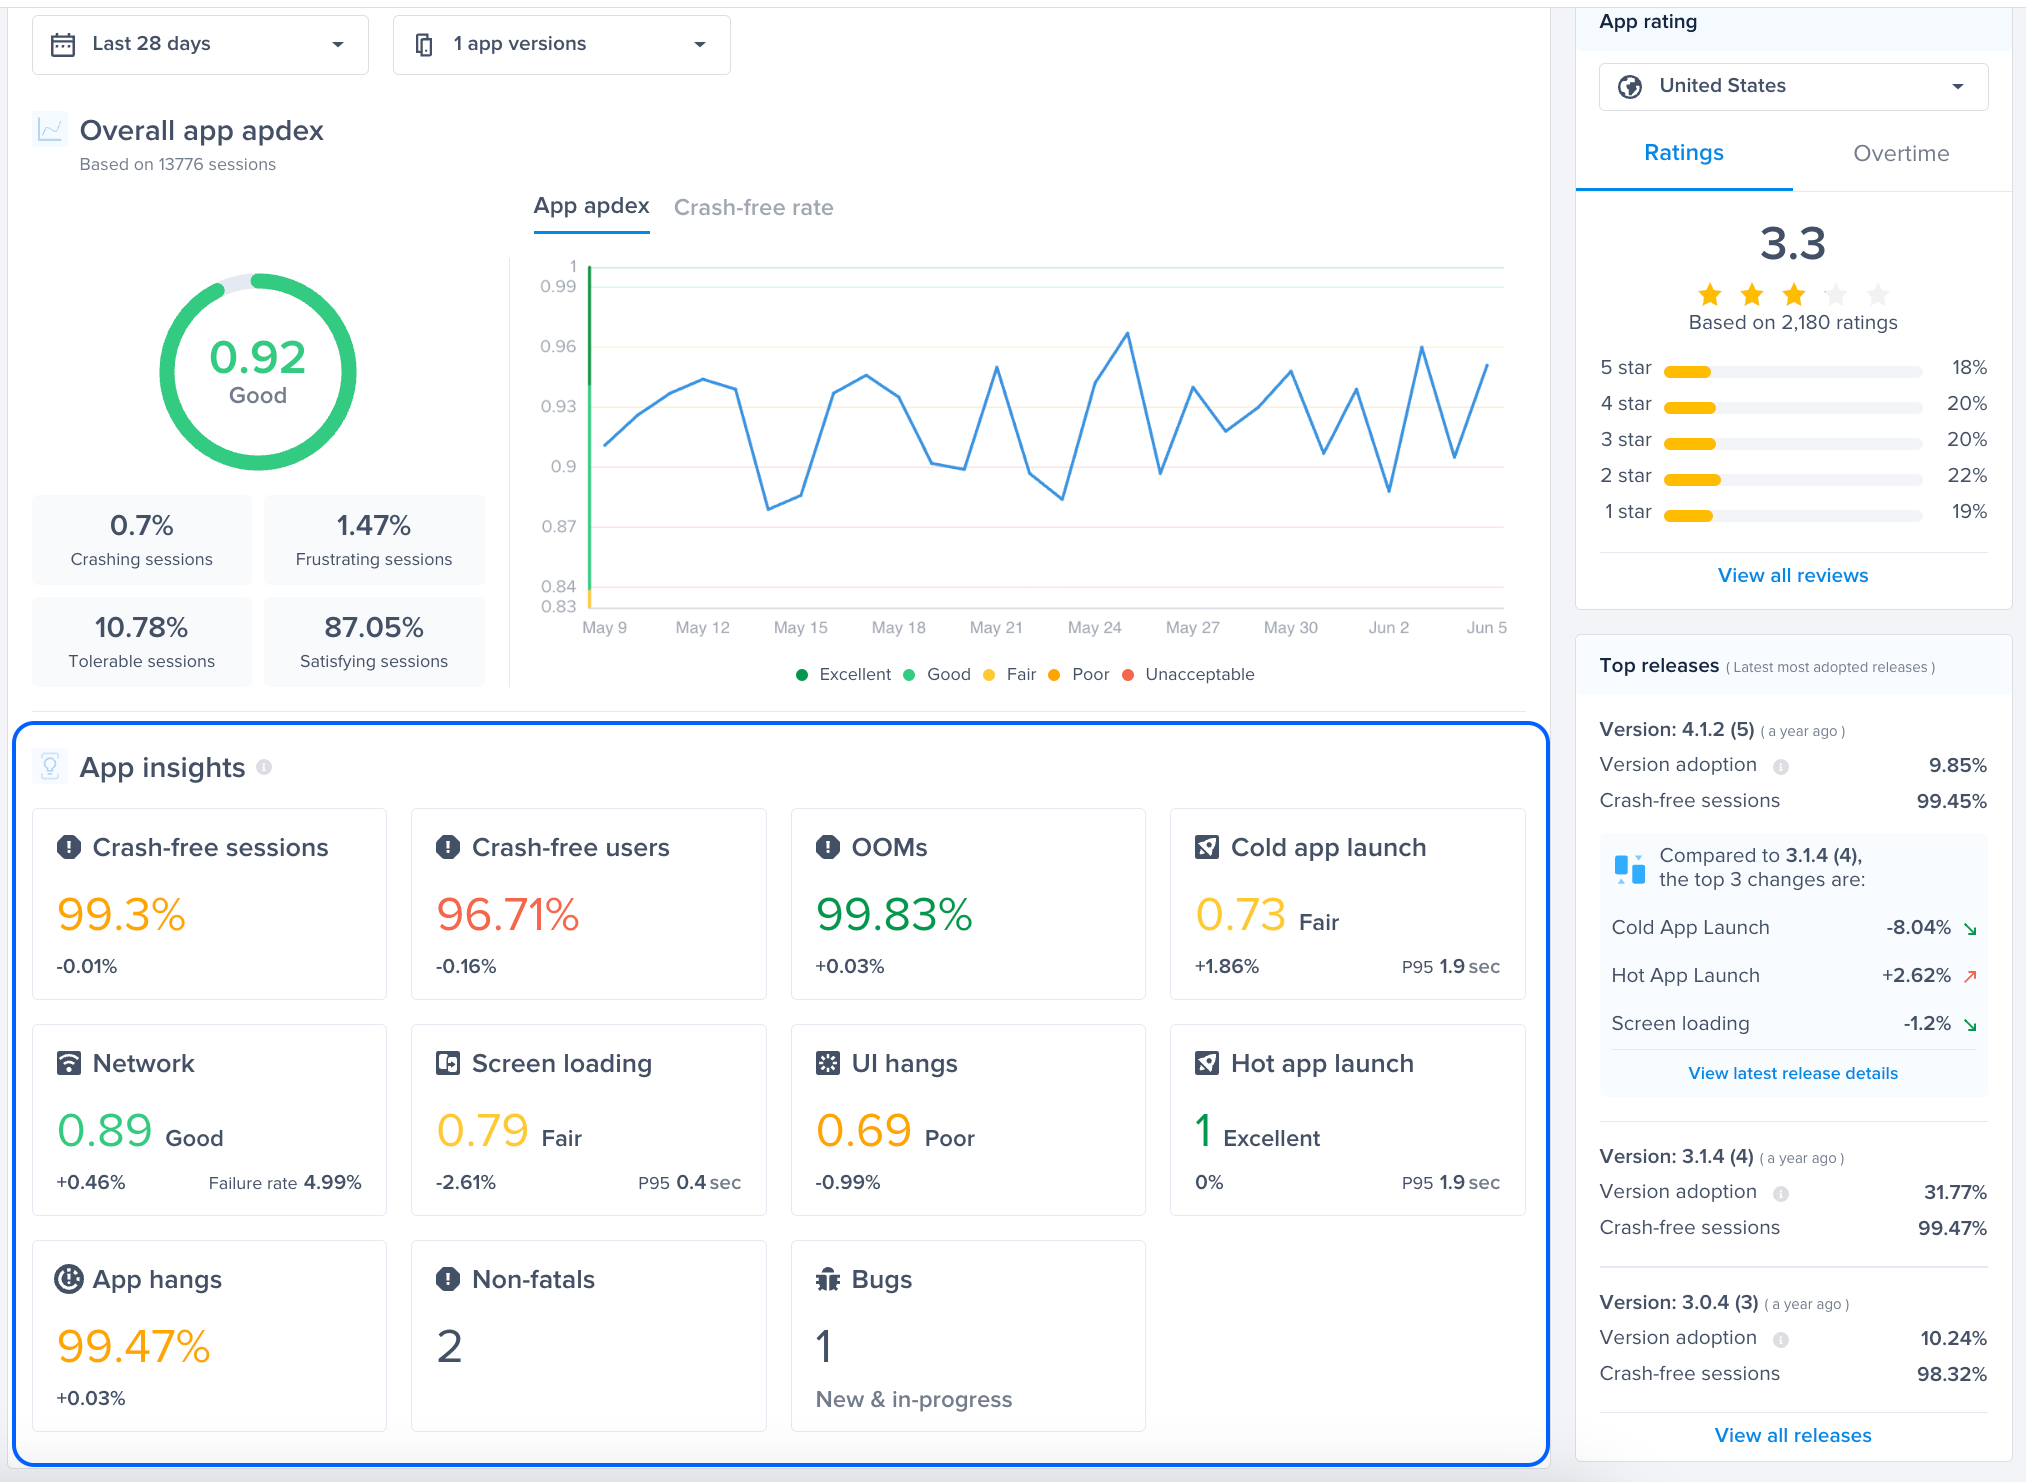
App Insights
This section provides detailed metrics on various aspects of your app’s performance, highlighted with red, yellow, and green indicators to show their status as well as a change rate calculated by comparing the current time period to the previous time period. So for example if you’re seeing data for the past 28 days, the change is calculated by comparing to the 28 days before that.
- Crash-Free Sessions: Percentage of sessions without crashes.
- Crash-Free Users: Percentage of users who did not experience crashes.
- OOMs: Percentage of sessions without Out-Of-Memory errors.
- ANRs: Percentage of sessions without Application not Responding errors.
- Cold App Launch: Apdex score of the app when launched from a cold state based on its latency.
- Network: Network apdex score, calculated based on the performance of key network calls.
- Screen Loading: Apdex score of screen loading times.
- UI Hangs: Apdex score measuring the times your app faces UI hangs which is when the app isn't responding to the user's input for more than 250 ms.
- App Hangs: Percentage of sessions without App hangs which is when an app is unresponsive or more than 3 seconds.
- Non-Fatals: Number of non fatals reported.
- Bugs: Number of bugs reported.
App Ratings
This section gives you insights on your app ratings and reviews. It is filtered by country to understand regional user satisfaction.
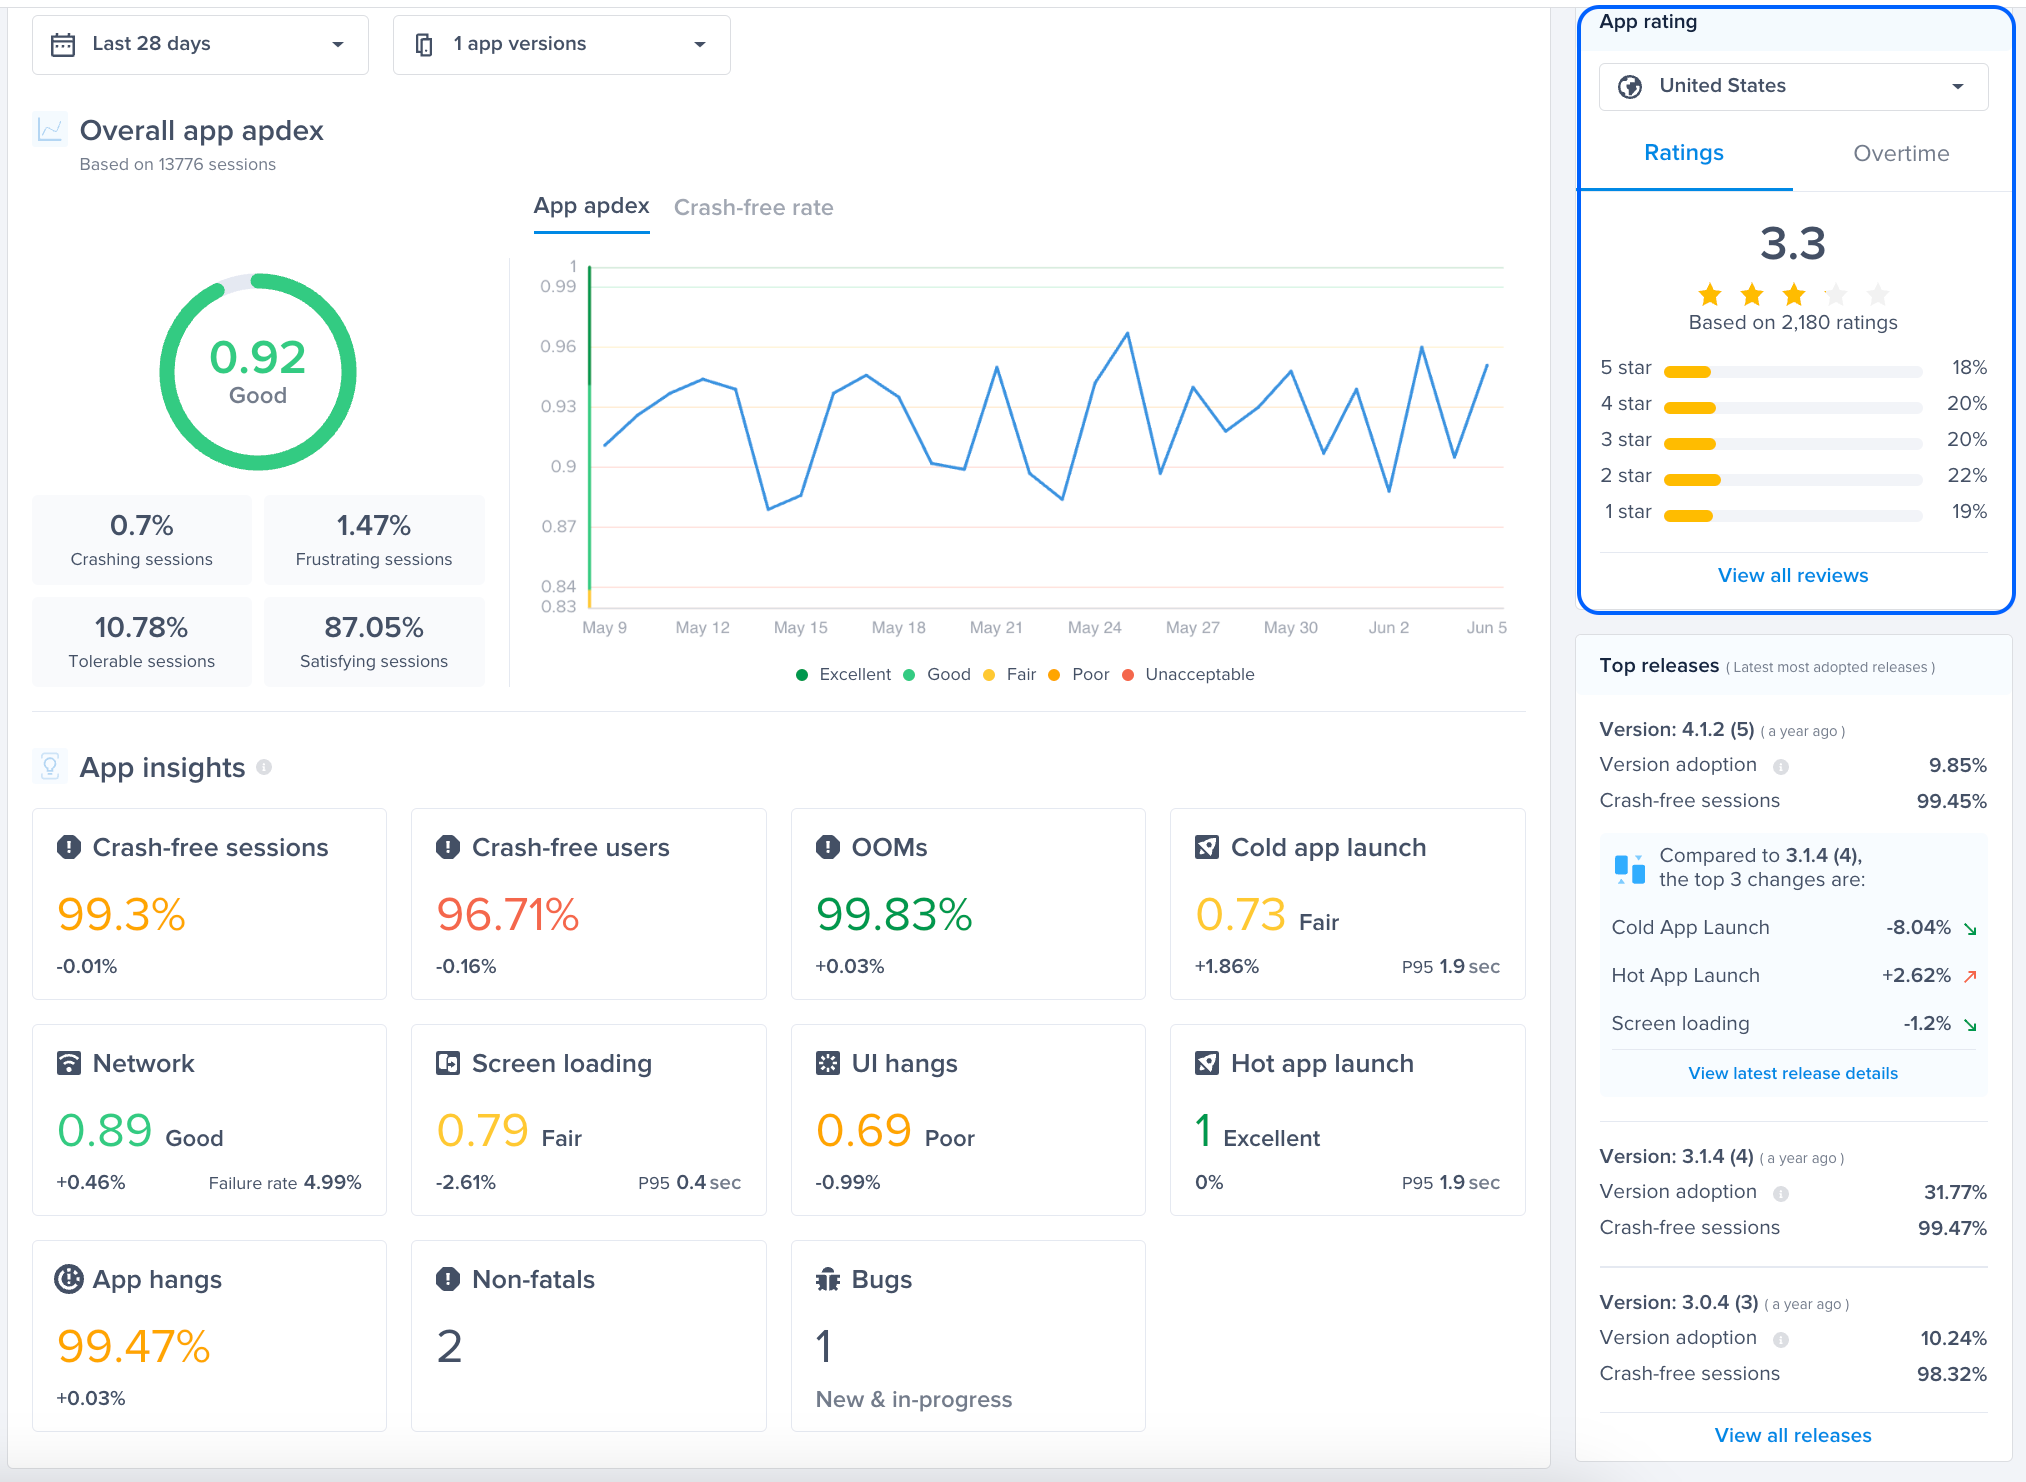
Top Releases
This section shows the latest most adopted app release and compares it with the previous versions. It includes:
- Version Details: Information about the latest version, such as version number and adoption rate.
- Comparative Metrics: Shows the top changes between the current most adopted version and the previous one.
Best Practices
The App Health Dashboard is a powerful tool for developers to monitor, analyze, and improve the performance and user experience of their application. Here are the best practices for utilizing this dashboard effectively:
- Regular Monitoring
- Daily Check-Ins: Make it a habit to review the dashboard daily to quickly catch any emerging issues.
- Focus on Key Metrics: Pay particular attention to the Overall Frustration-Free Sessions and the Crash-Free Sessions metrics to ensure your app is meeting performance standards.
- Analyzing Trends Over Time
- Utilize the Graphs: Use the "Frustration-Free Sessions and Crash-Free Sessions Over Time" graph to identify patterns or recurring issues. Look for dips in performance or spikes in crashes that correlate with specific timeframes or events (e.g., new releases).
- Historical Comparison: Compare current performance metrics with historical data to understand how recent changes impact app stability and performance.
- Deep Dive into App Insights
- Prioritize Red Metrics: Focus on metrics highlighted in red in the "App Insights" section as they indicate critical issues needing immediate attention.
- For example, if the “Cold App Launch” Apdex drops, click on it to navigate to the the “Cold App Launch” page to analyze it more.
- Continuous Improvement: Aim to turn yellow metrics to green by systematically addressing the underlying issues.
- Prioritize Red Metrics: Focus on metrics highlighted in red in the "App Insights" section as they indicate critical issues needing immediate attention.
Updated 5 months ago