Session Profiler for Flutter
This section covers the details contained in the Session Profiler that appears with all bug reports in your dashboard for Flutter apps.
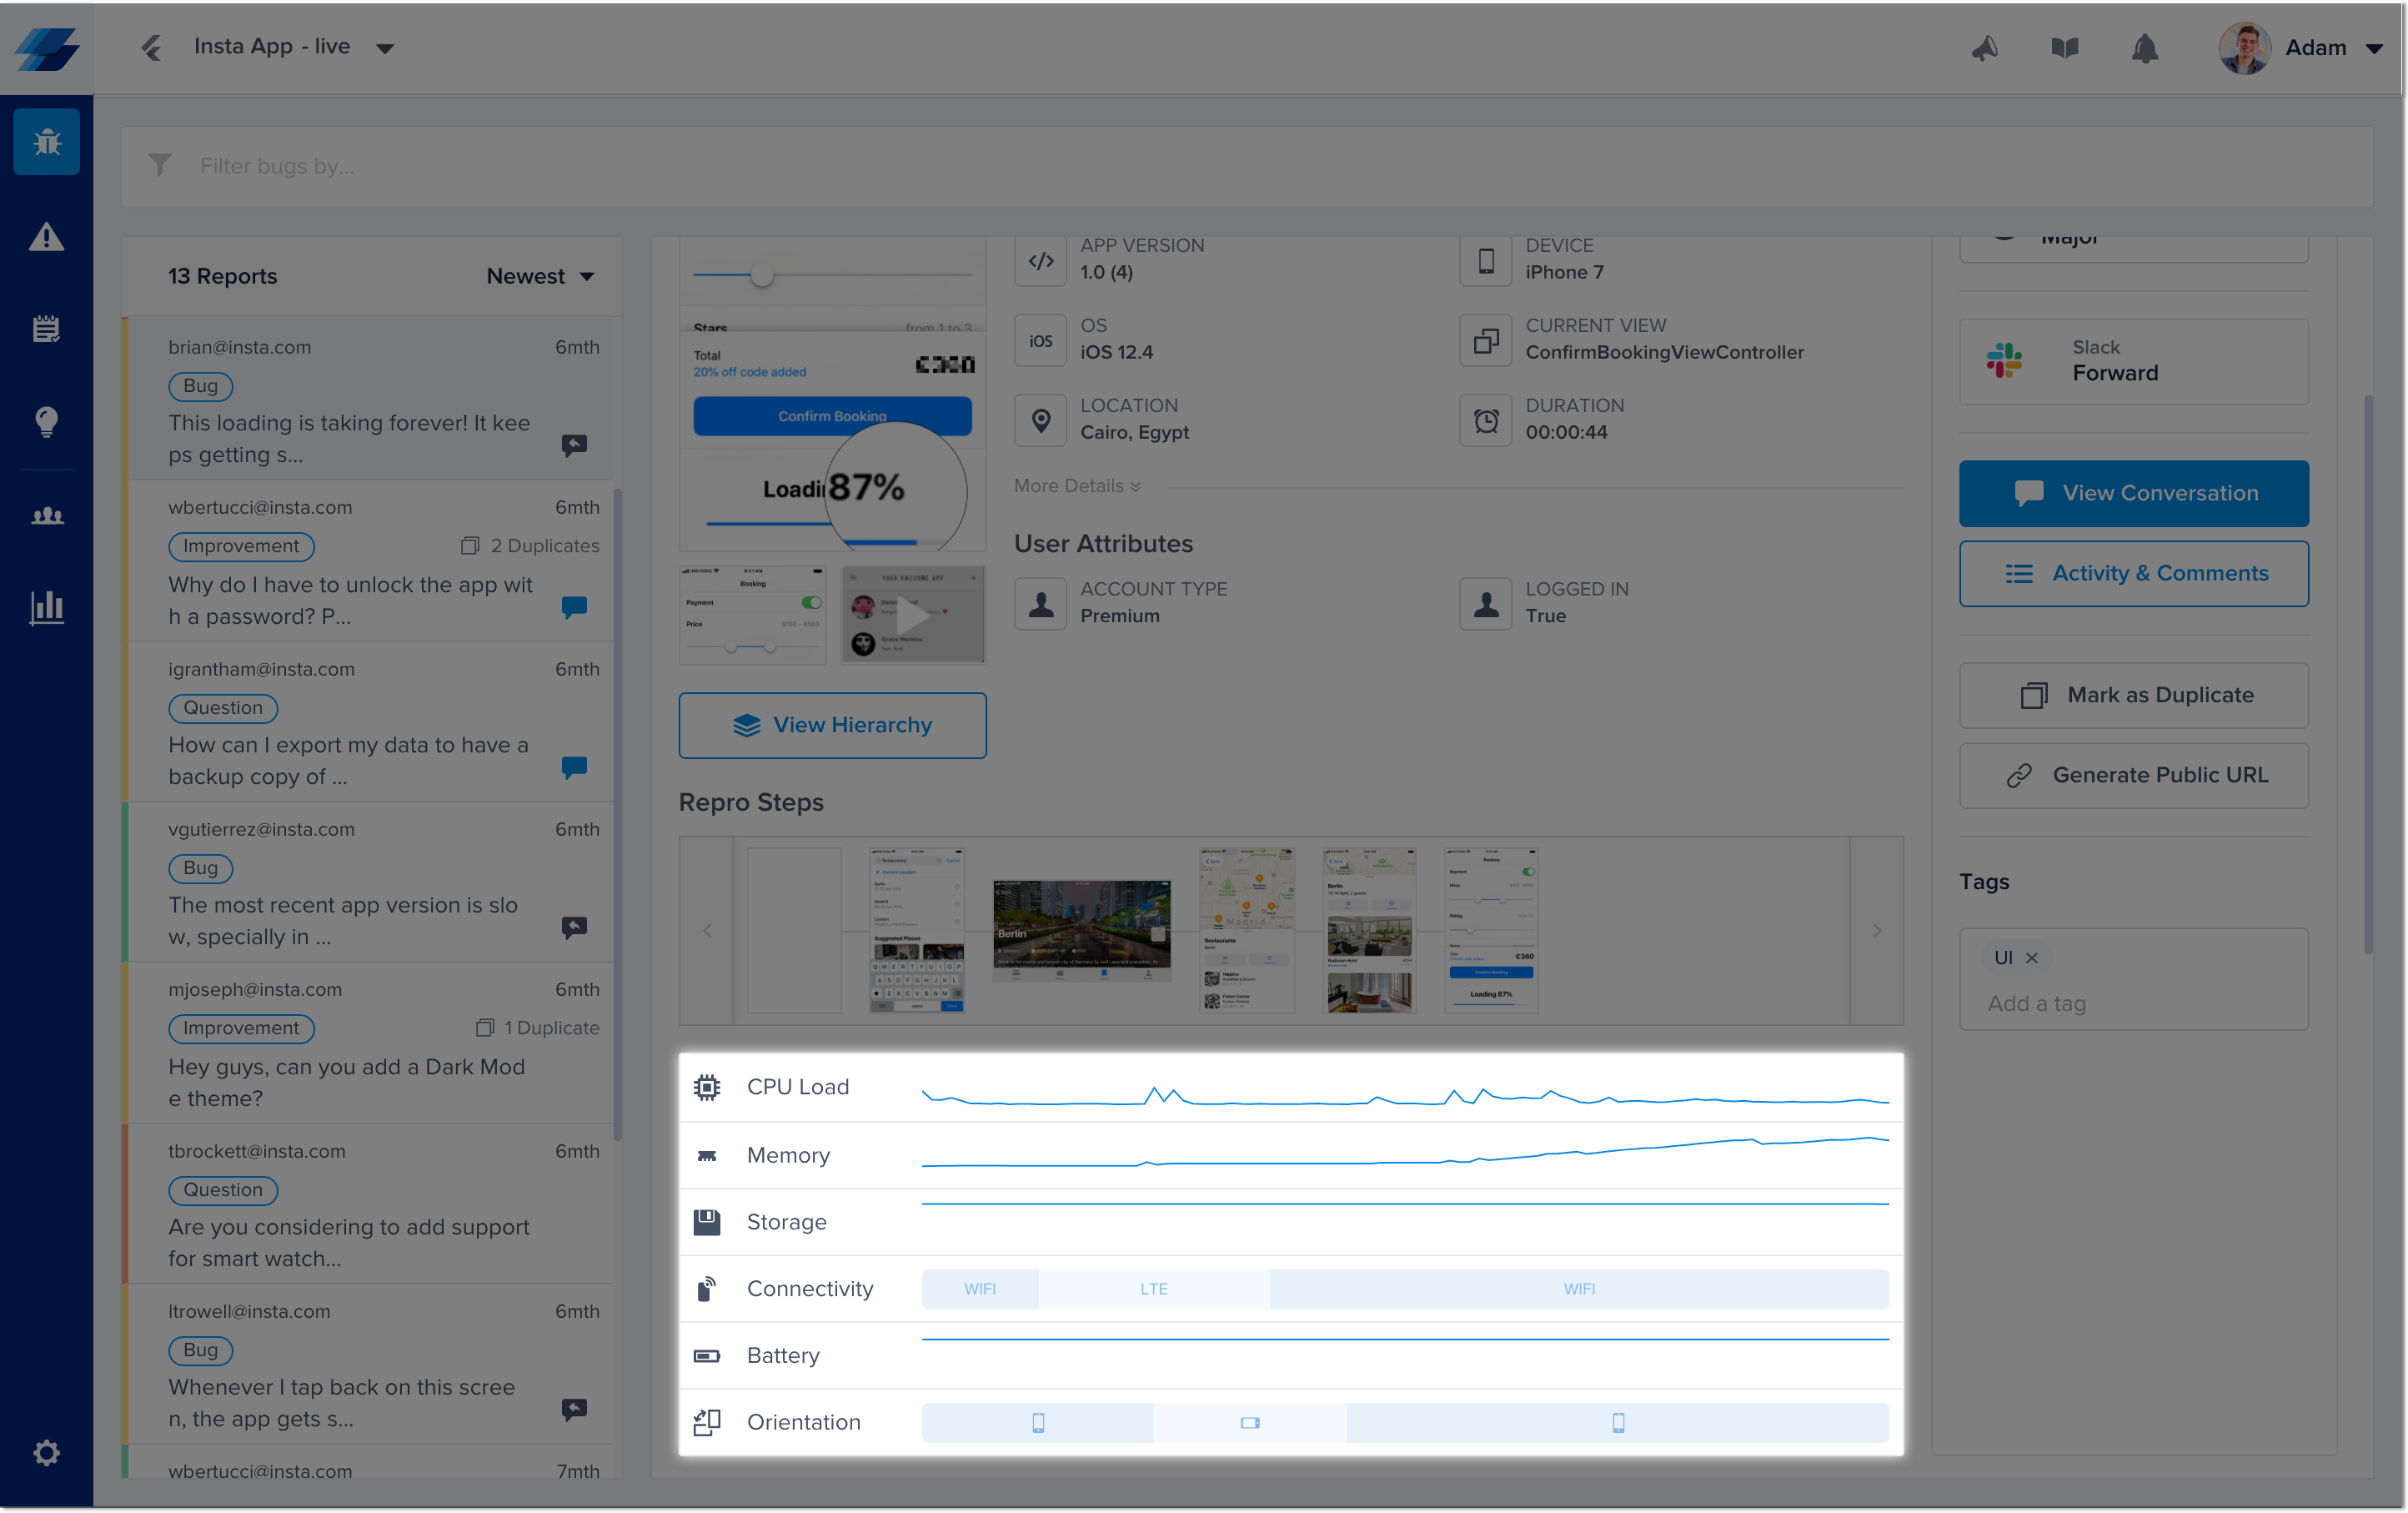
The Session Profiler captures the state of the device as well as your app in the 60 seconds before a report is sent.

This is the Session Profiler in a bug report in the Instabug dashboard.
Data Breakdown
CPU
This graph shows the CPU usage of your application. While hovering over the graph, the exact CPU load of the app, in percentage, is shown. App CPU usage is captured every 0.5 seconds. This is available for iOS only.
Memory
This graph shows the memory usage of your user's device. While hovering over a graph, the exact memory usage is shown over the total amount of memory available, as well as the exact usage percentage. Device memory usage is captured every 0.5 seconds. This is available for iOS only.
Storage
This graph shows how much storage is used by the device. While hovering over a graph, the exact storage usage is shown over the total amount of storage available, as well as the exact usage percentage. Device storage usage is captured every 0.5 seconds.
Connectivity
This graph shows the connectivity details of the device. While hovering over a graph, connectivity details are shown such as WiFi name, cellular connectivity type (GPRS, Edge, 3G, LTE or CDMA), carrier name, and "No connection" if there is no network connectivity. Device connectivity details are captured every two seconds.
Battery
This graph shows the battery percentage of the device. While hovering over a graph, the exact percentage of the battery is shown, as well as whether or not the device is plugged in. Device battery state is captured every two seconds.
Orientation
This graph shows the orientation state of the application, such as whether the application is in portrait or landscape mode. While hovering over a graph, the exact state is shown. App orientation is captured every two seconds.
Enabling and Disabling
Session Profiler is enabled by default, however, you can use the below method to enable or disable it manually.
Instabug.setSessionProfilerEnabled(true);
Updated almost 2 years ago
The Session Profiler is sent with every bug report. Check it out to see where you can find it. Logging can also help you find those issues even faster.
