
Instrumentation for iOS
This page explains the automatic and custom instrumentations offered among multiple APM metrics for iOS apps.
Spans
Spans allow you to understand better the root causes of the latencies that occur during your app’s launch and screen loading. This section provides a detailed breakdown of the duration of the platform life cycle stages, network calls, and more information during the app launch and screen loading.

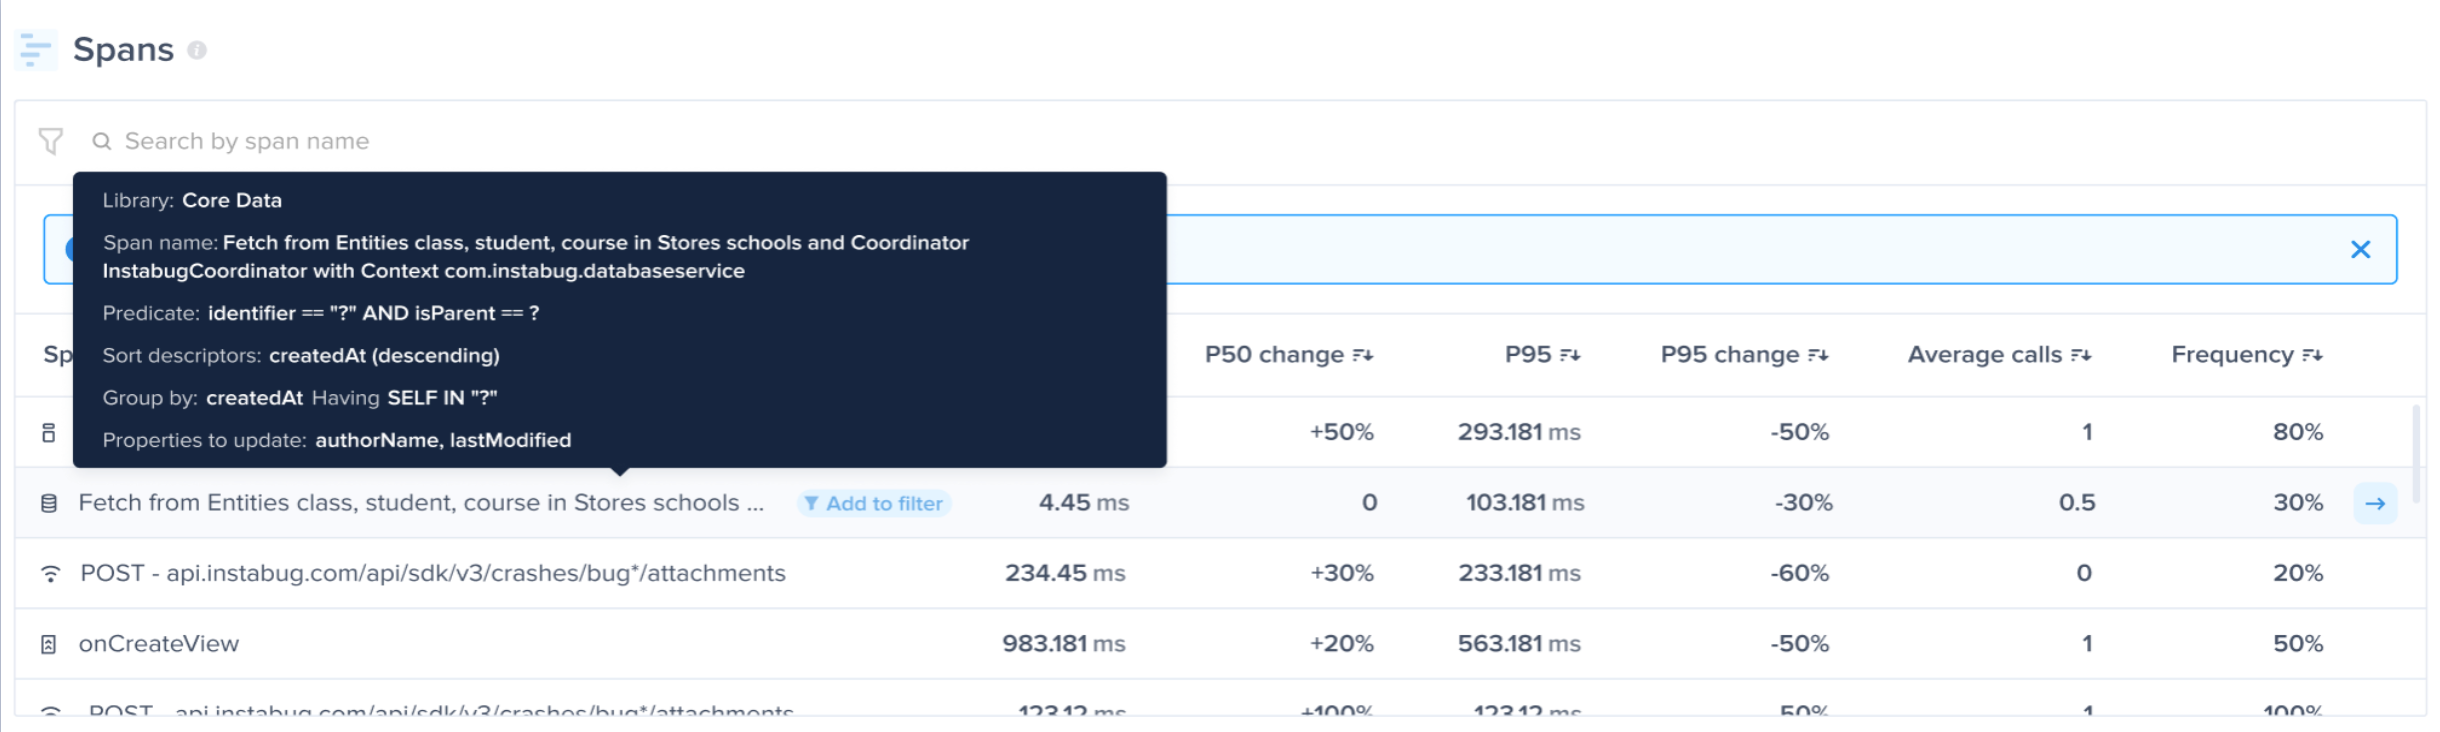
Spans Table Breakdown
| Span Name | This shows the stage or request name to identify its source. |
| P50 | This is the 50th percentile, which is the maximum latency that 50% of all the occurrences have in the selected time period and is shown in ms. |
| P95 | This is the 95th percentile, which is the maximum latency that 95% of all the occurrences have in the selected time period and is shown in ms. |
| P50 & P95 Change | This shows the change rate of P50 & P95 durations in comparison to the last period based on the selected date filter. |
| Average Calls | This shows how many times the span happened per single occurrence to understand its redundancy better. To get the overall duration of this span, multiply the Average Call by the P50/P95. |
| Frequency | This is how many times the span happened per all occurrences of the specified metric. |
Supported Span Types
These are the currently supported Span Types:
- View Loading.
- Network.
- App Initialization.
- Database Queries.
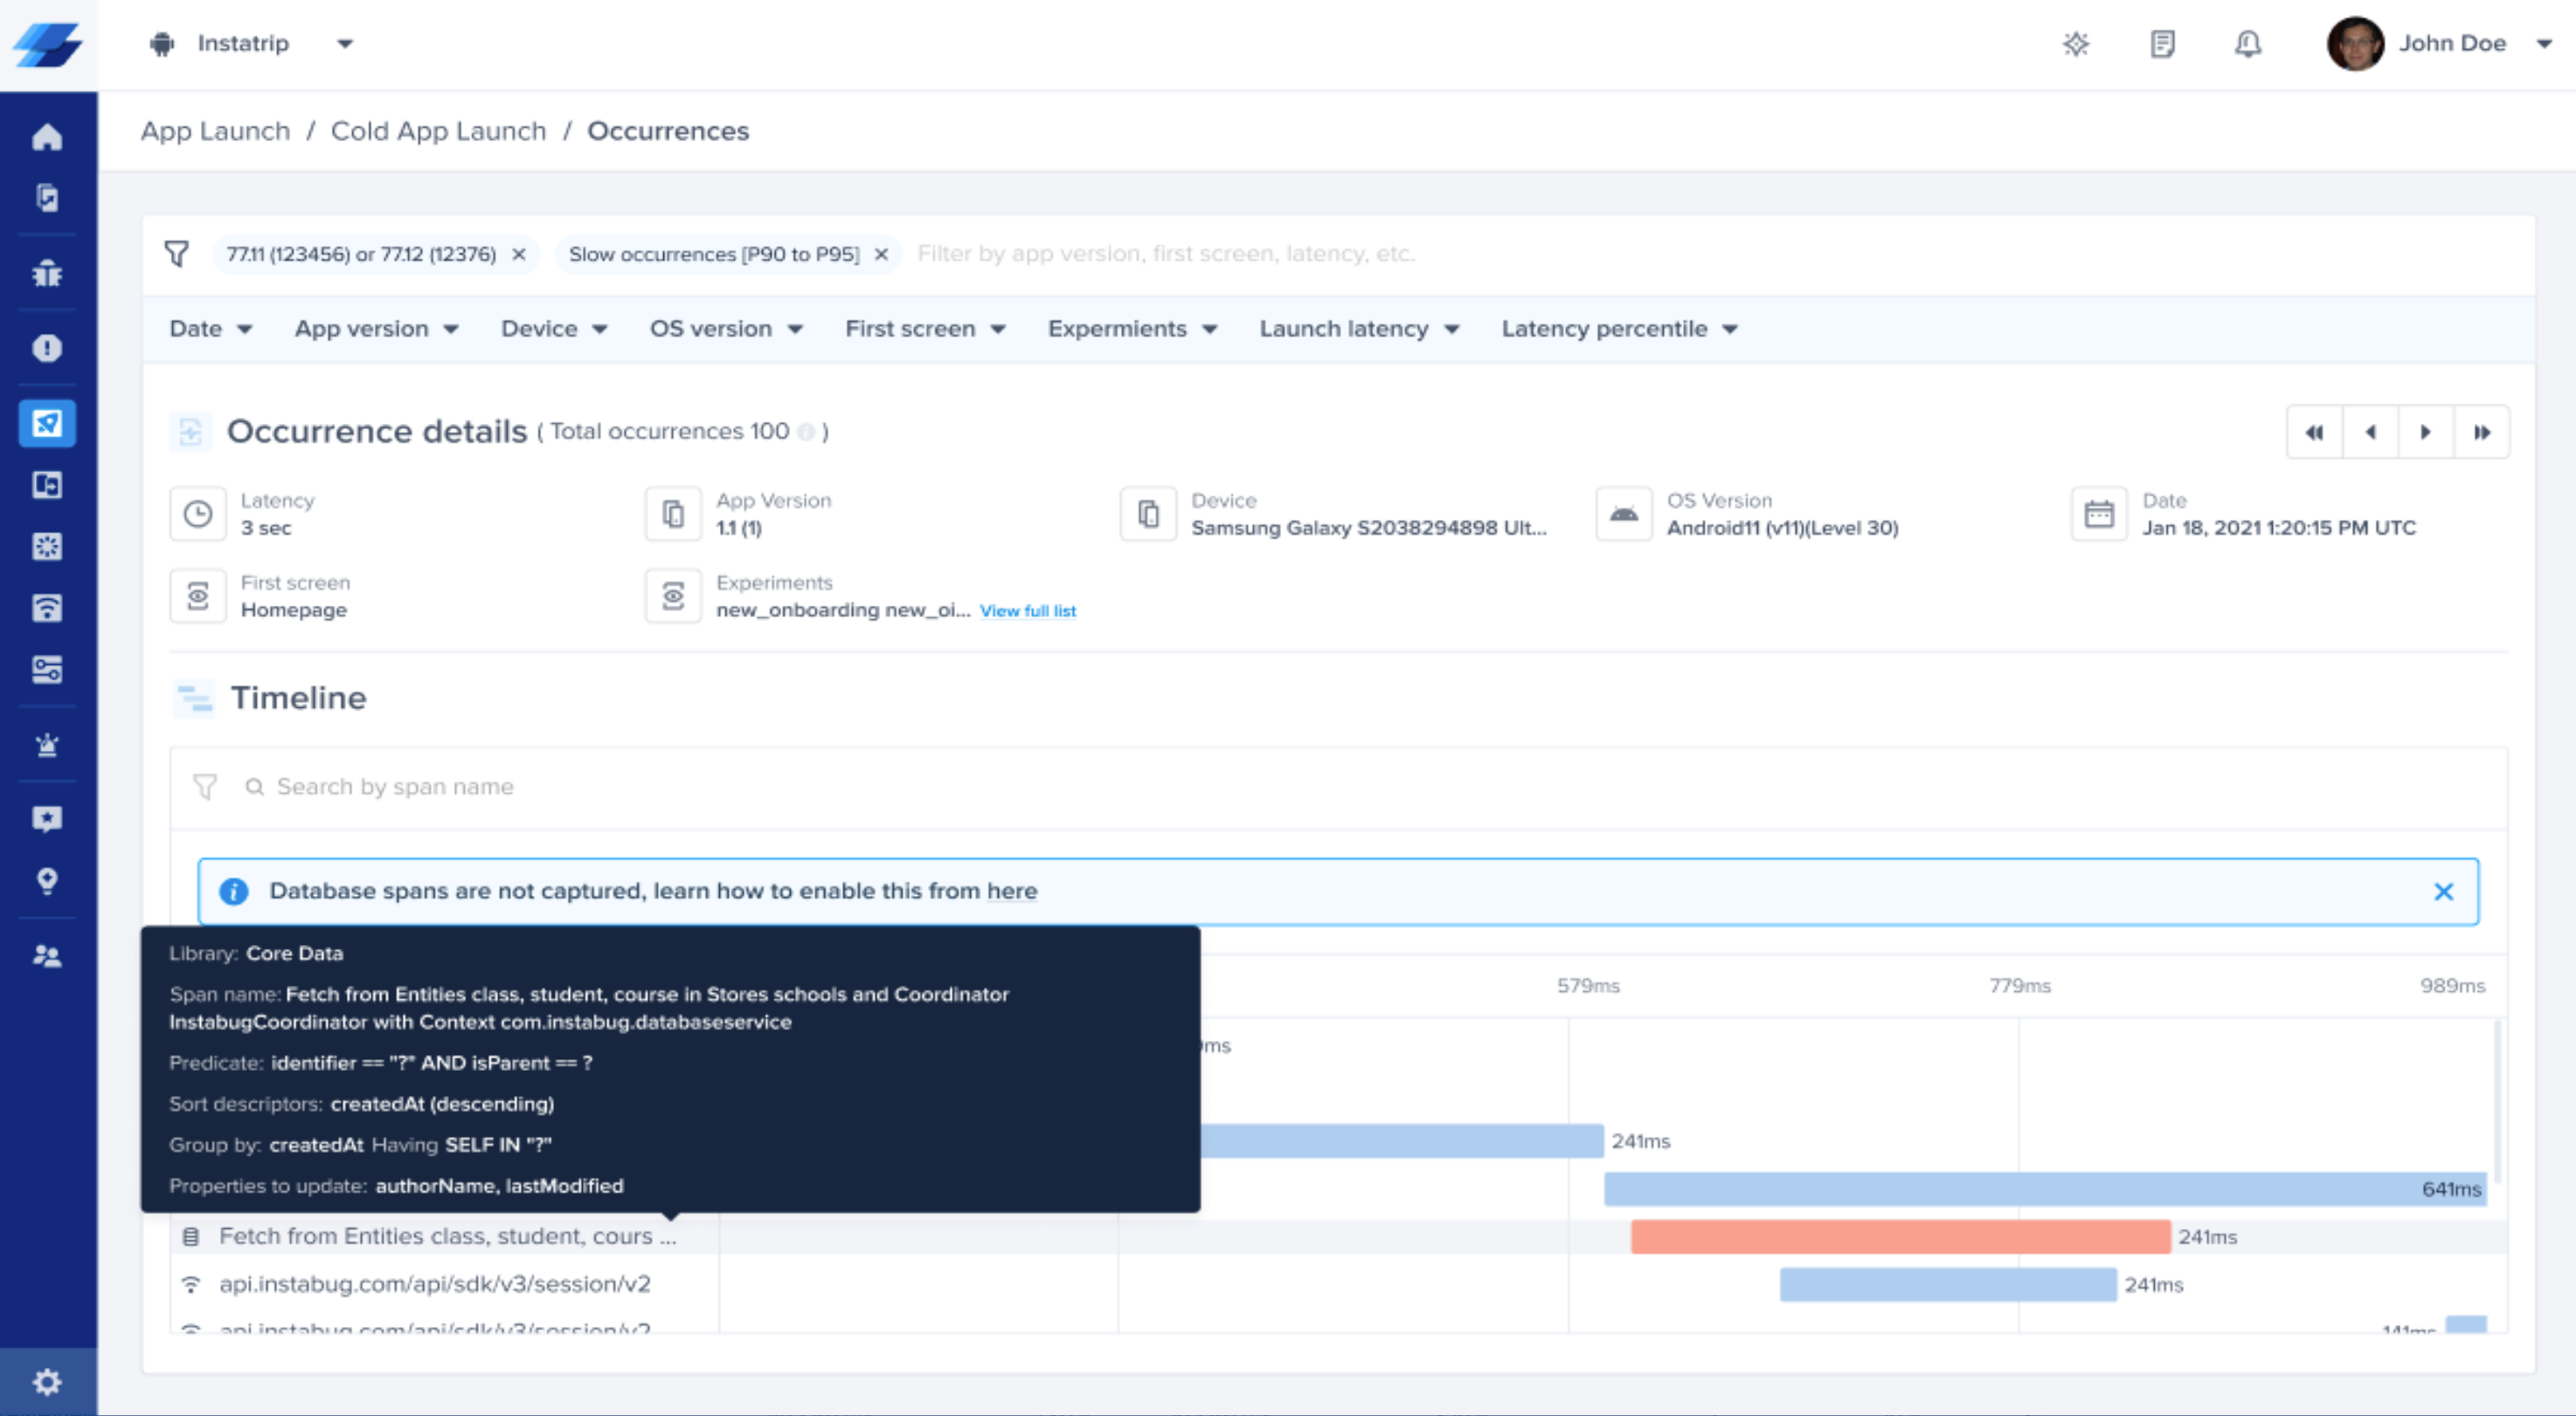
Database Queries
You'll be able to see the Database queries that happen during your app launch or screen loading with all its details in the spans table and occurrences view.
Spans Table in Network Metric
To help you have a better understanding of what's causing the bulk delays inside your network calls, either from the Client, Server, or Network sides, you'll be able to see a detailed breakdown of the latencies caused by the stages/operations that were made to send the network request and receive its response from the server on aggregation and occurrence levels inside the network metric.
You can read more about the Spans table in Network Metric here.
If you are using the
EndAppLaunchorEndScreenLoadingAPIs, Instabug captures the duration from the start of the app launch or screen loading up until the call of any of both APIs.
Updated almost 2 years ago