
New Relic
Overview
The new Instabug integration with New Relic enables end-to-end tracing for network calls, connecting client-side and server-side monitoring for your network requests. By using a unique trace ID, you can follow any network request from the client to the server, providing insights for troubleshooting networking issues.
Prerequistes
New Relic
To use this integration, ensure the following prerequisites are met in your New Relic setup:
- Distributed Tracing in Your Plan: Ensure that your New Relic plan includes distributed tracing.
- New Agent Supporting W3C Context Propagation: You need to use a New Relic agent that supports W3C context propagation. More details can be found here.
- Enable Distributed Tracing in Backend Agent: Distributed tracing must be enabled in your backend agent. More information is available here.
Note: if you use any trace sampling algorithms, New Relic may drop some traces. Consequently, you might see network requests in Instabug that are not available in New Relic.
Instabug
- Supported Platforms: This integration is only supported for iOS and Android.
- Instabug SDK Version: Ensure you have a minimum SDK v13.2.0 or higher on either iOS or Android.
Integration Steps
By setting up this integration, Instabug will attach a trace ID as an HTTP header to your network requests. This allows us to link network requests from Instabug to New Relic.
Go to Settings -> Integrations -> New Relic in your Instabug dashboard, and follow these integration steps:
-
Set Up:
Enter your New Relic dashboard link. If you use custom domains for New Relic, replace
one.newrelic.comwith your company domain (e.g.,x.newrelic.com). For redirecting to multiple organizations from the same app, useone.newrelic.com.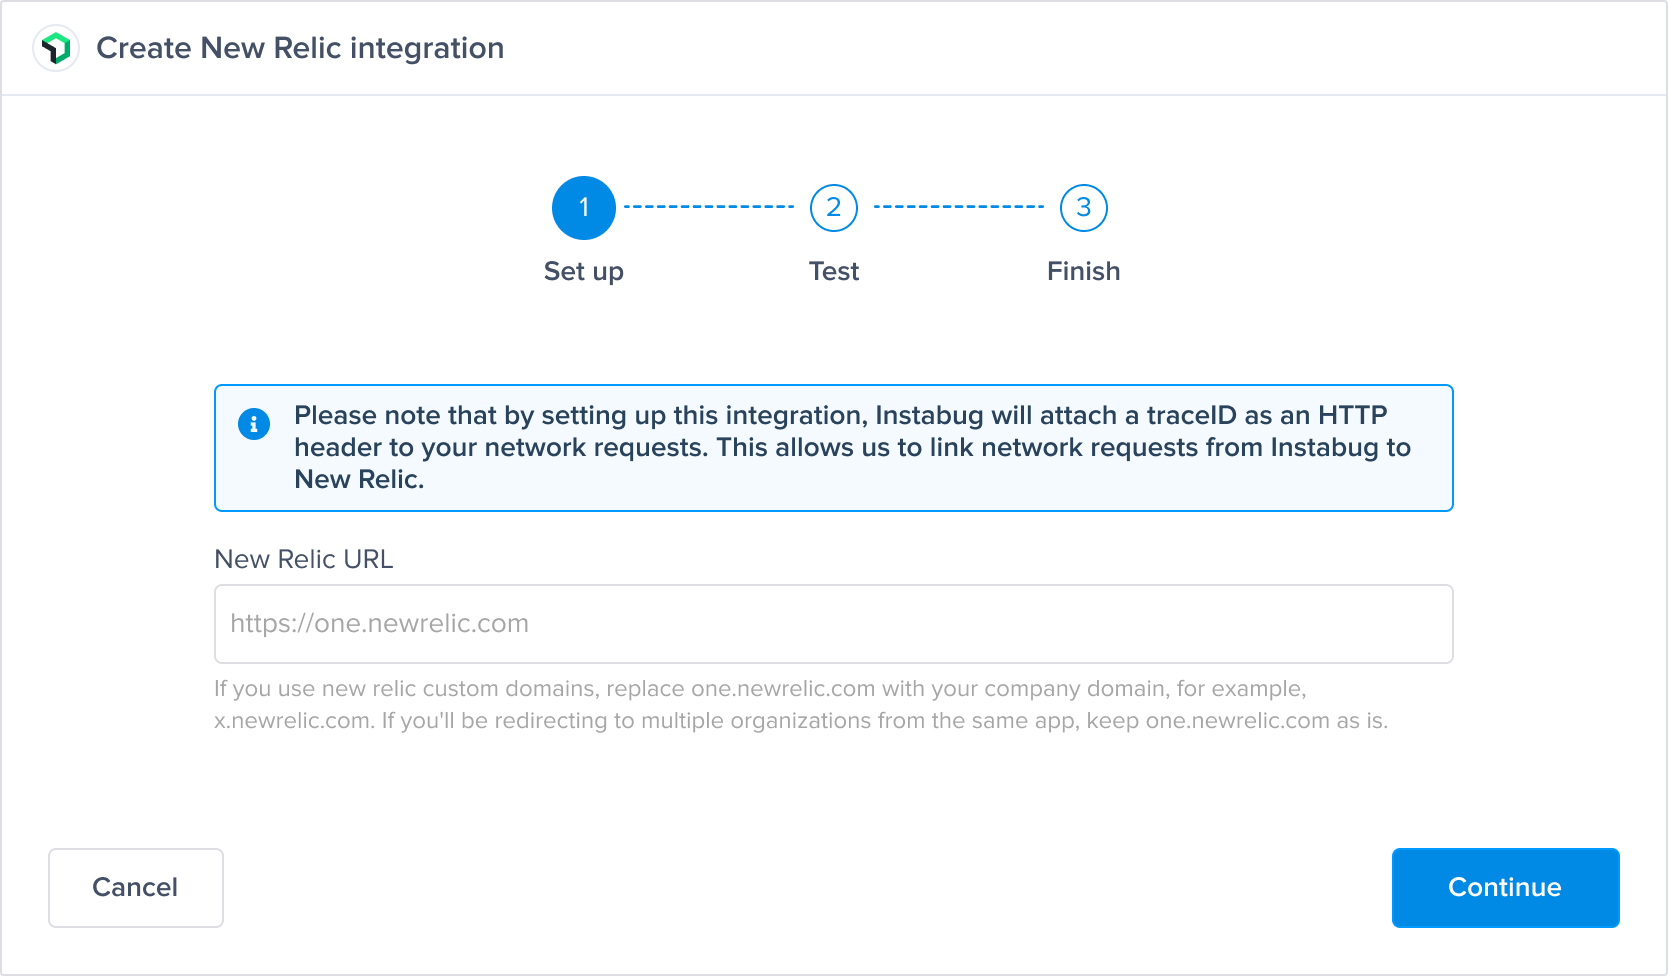
-
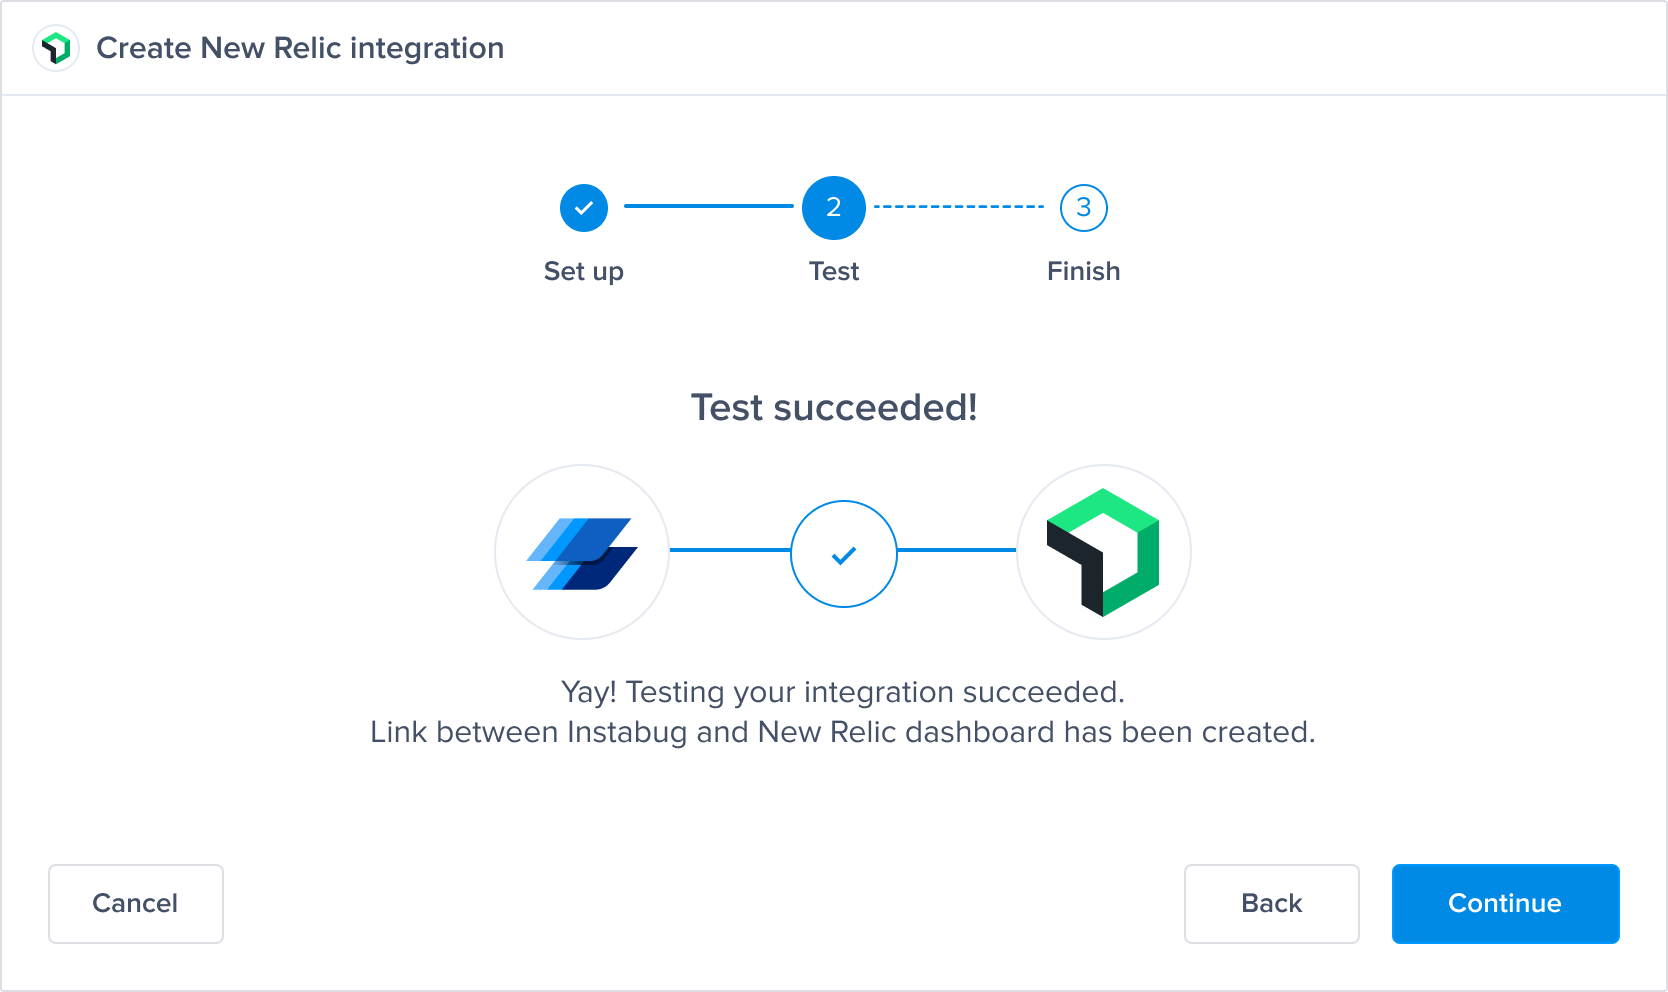
Test:
Validate the New Relic dashboard link to ensure it is correct.
-
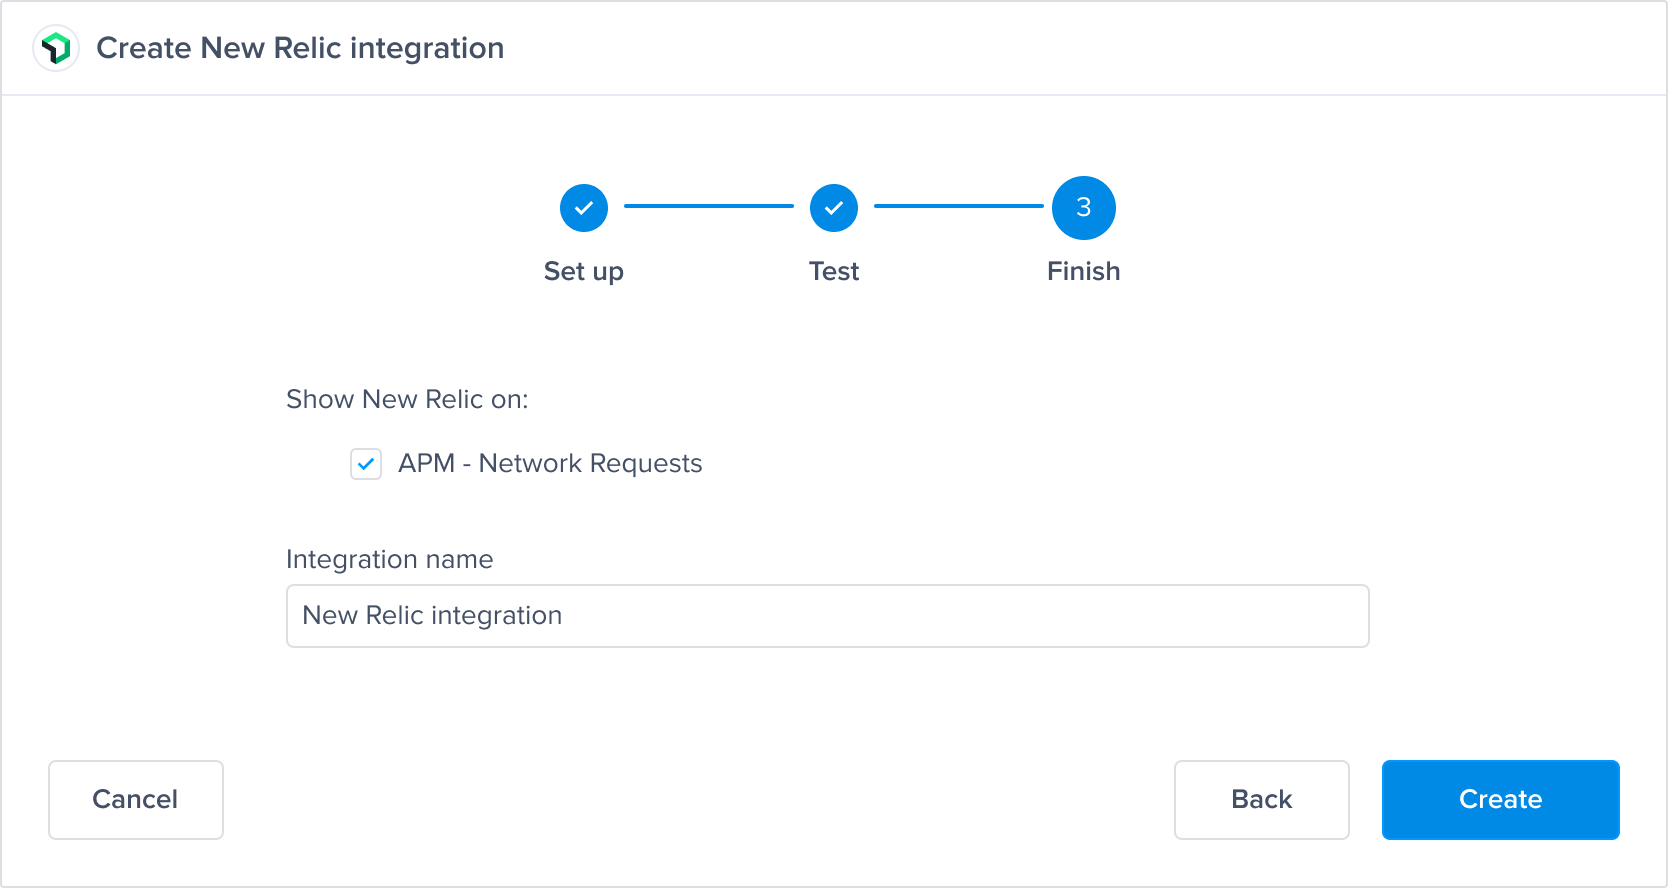
Finish:
Ensure the APM - Network Requests checkbox is checked to trace network requests to New Relic, then give your integration a name and save the integration.
Using the integration
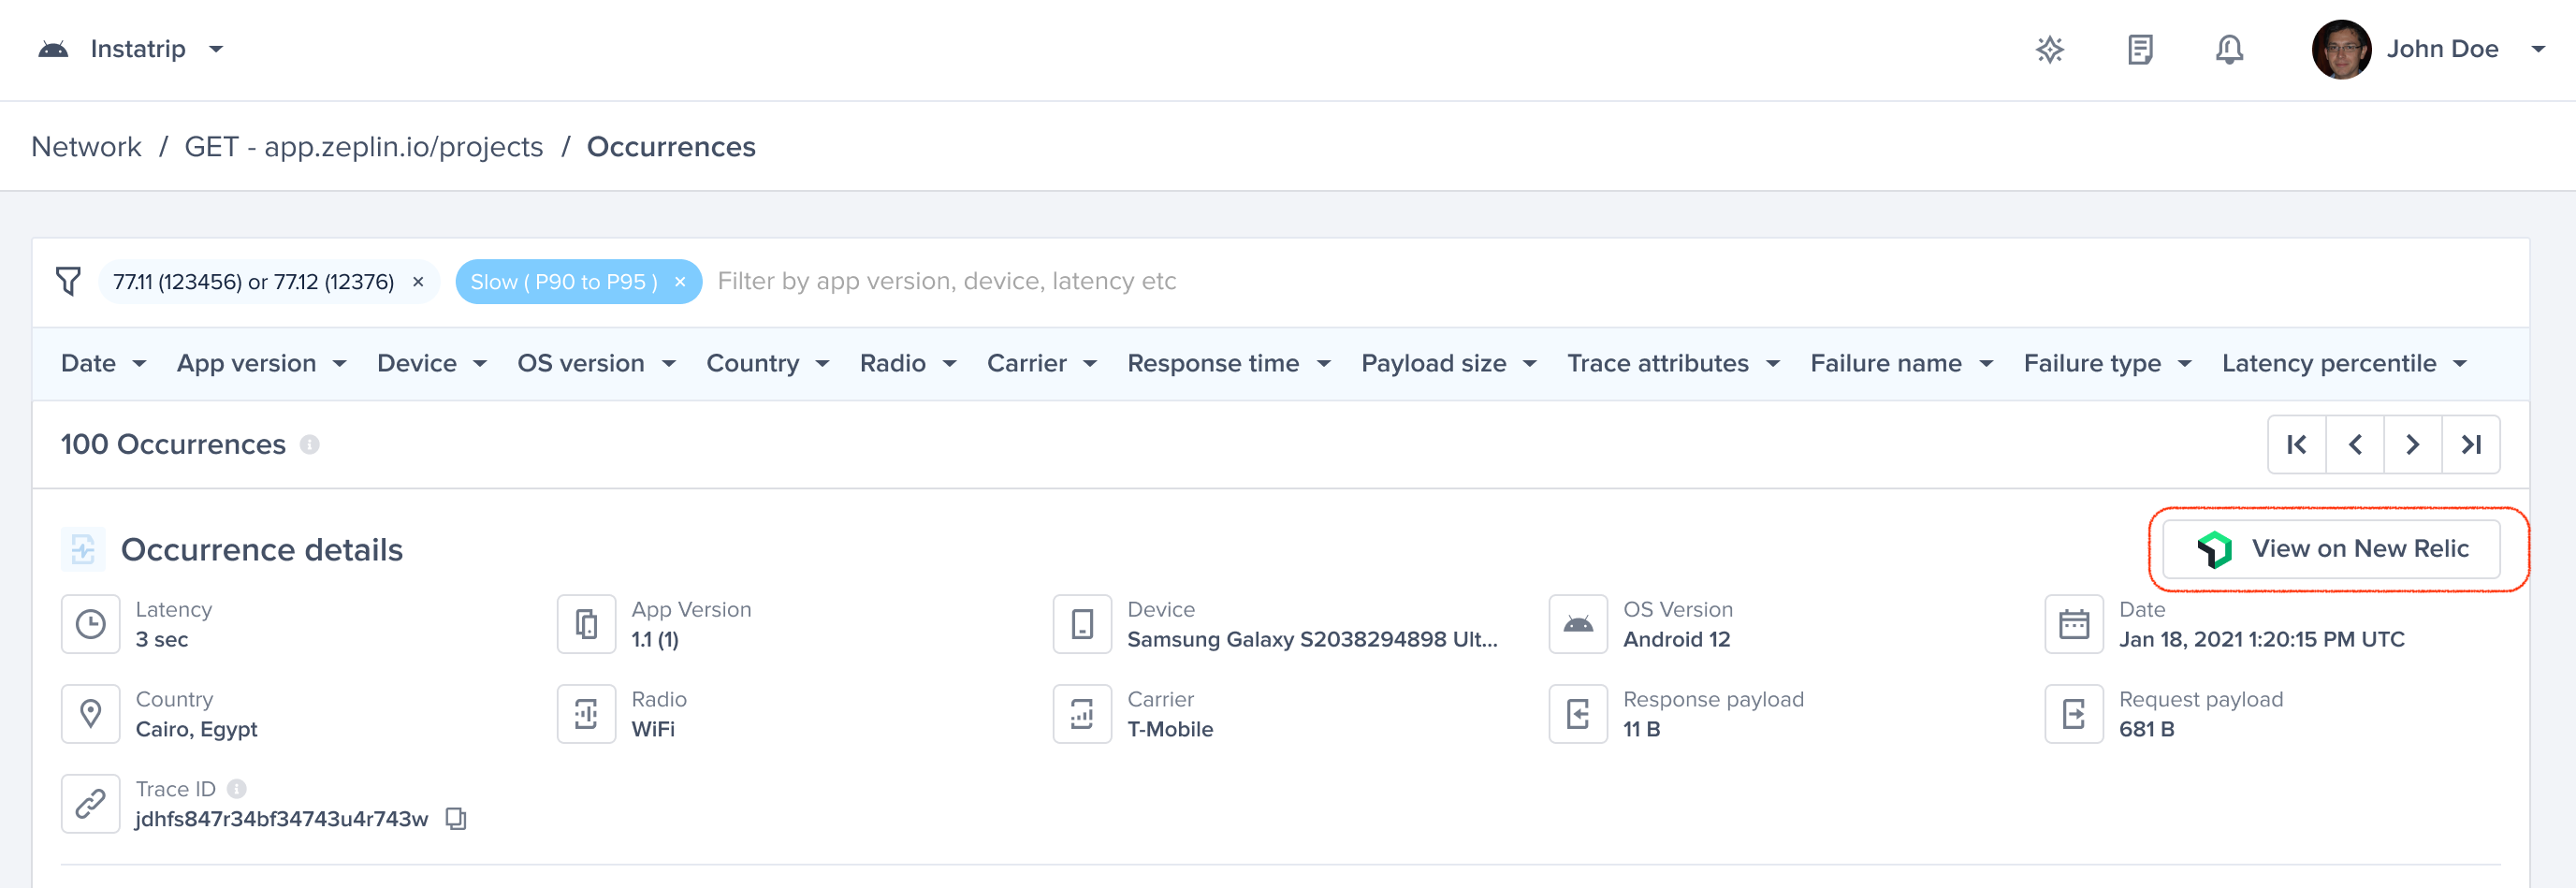
When a network occurrence is logged, a unique trace ID will appear on the occurrence page in the Instabug dashboard.
-
Navigate to any network occurrence and copy the Trace ID.
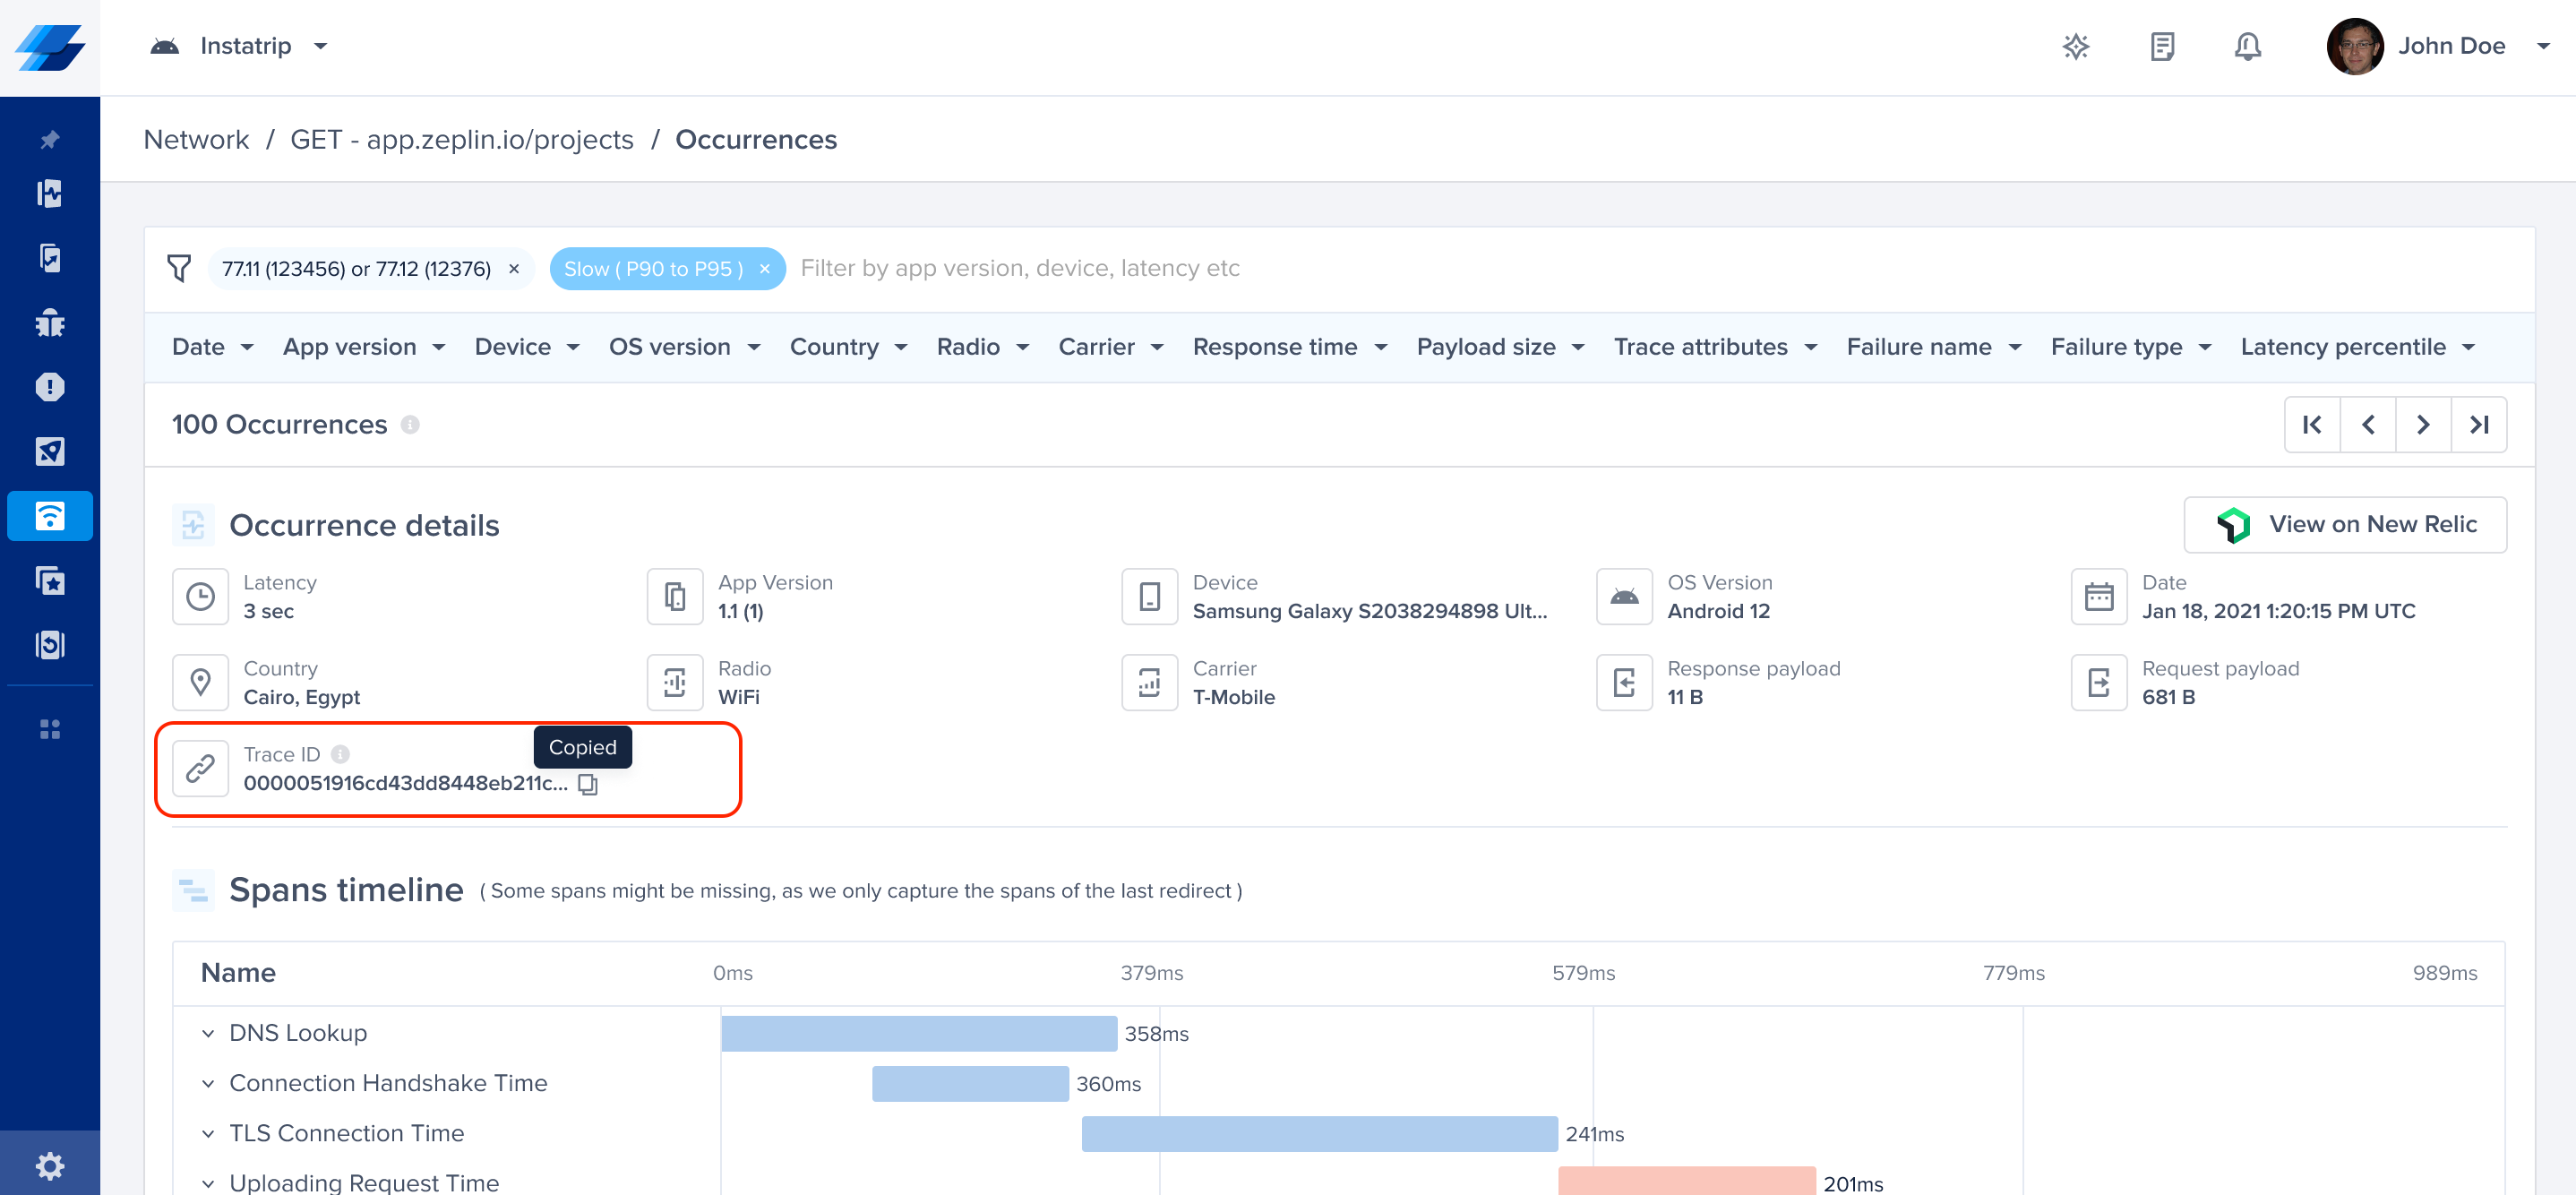
-
Click on "View on New Relic" to go to the traces page in New Relic.

-
Paste the Trace ID into the filter in New Relic (traceid = xxxxx) to view the same trace.

Updated about 1 year ago