
Frustration-Free Sessions for Flutter
This page covers frustration-free sessions for Flutter.
What is Frustration-Free Sessions?
Frustration-Free Sessions is a north star KPI that reflects user frustration. It helps you measure your app’s stability and performance, giving you a clear signal when users experience frustrating sessions.
The score ranges from 0% to 100%, where a higher score means your users are facing fewer frustrating experiences.
How Is Frustration-Free Sessions Calculated?
Instabug categorizes all user sessions into four types:
- Crashing Sessions → Sessions that end with a fatal crash or OOM.
- Frustrating Sessions → Sessions with major issues
- Tolerable Sessions → Sessions with minor issues
- Satisfying Sessions → Sessions with smooth performance
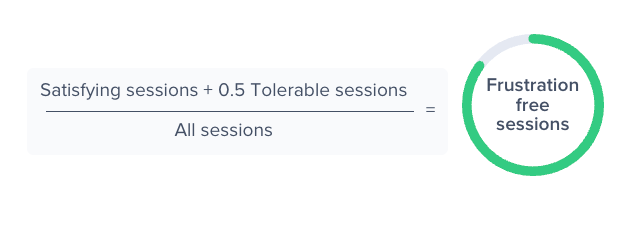
The Frustration-Free Sessions score is calculated as:
What Is a Session?
A session begins when a user launches the app or brings it to the foreground. It ends when the user moves the app to the background or when the app exits (either manually or due to a crash).
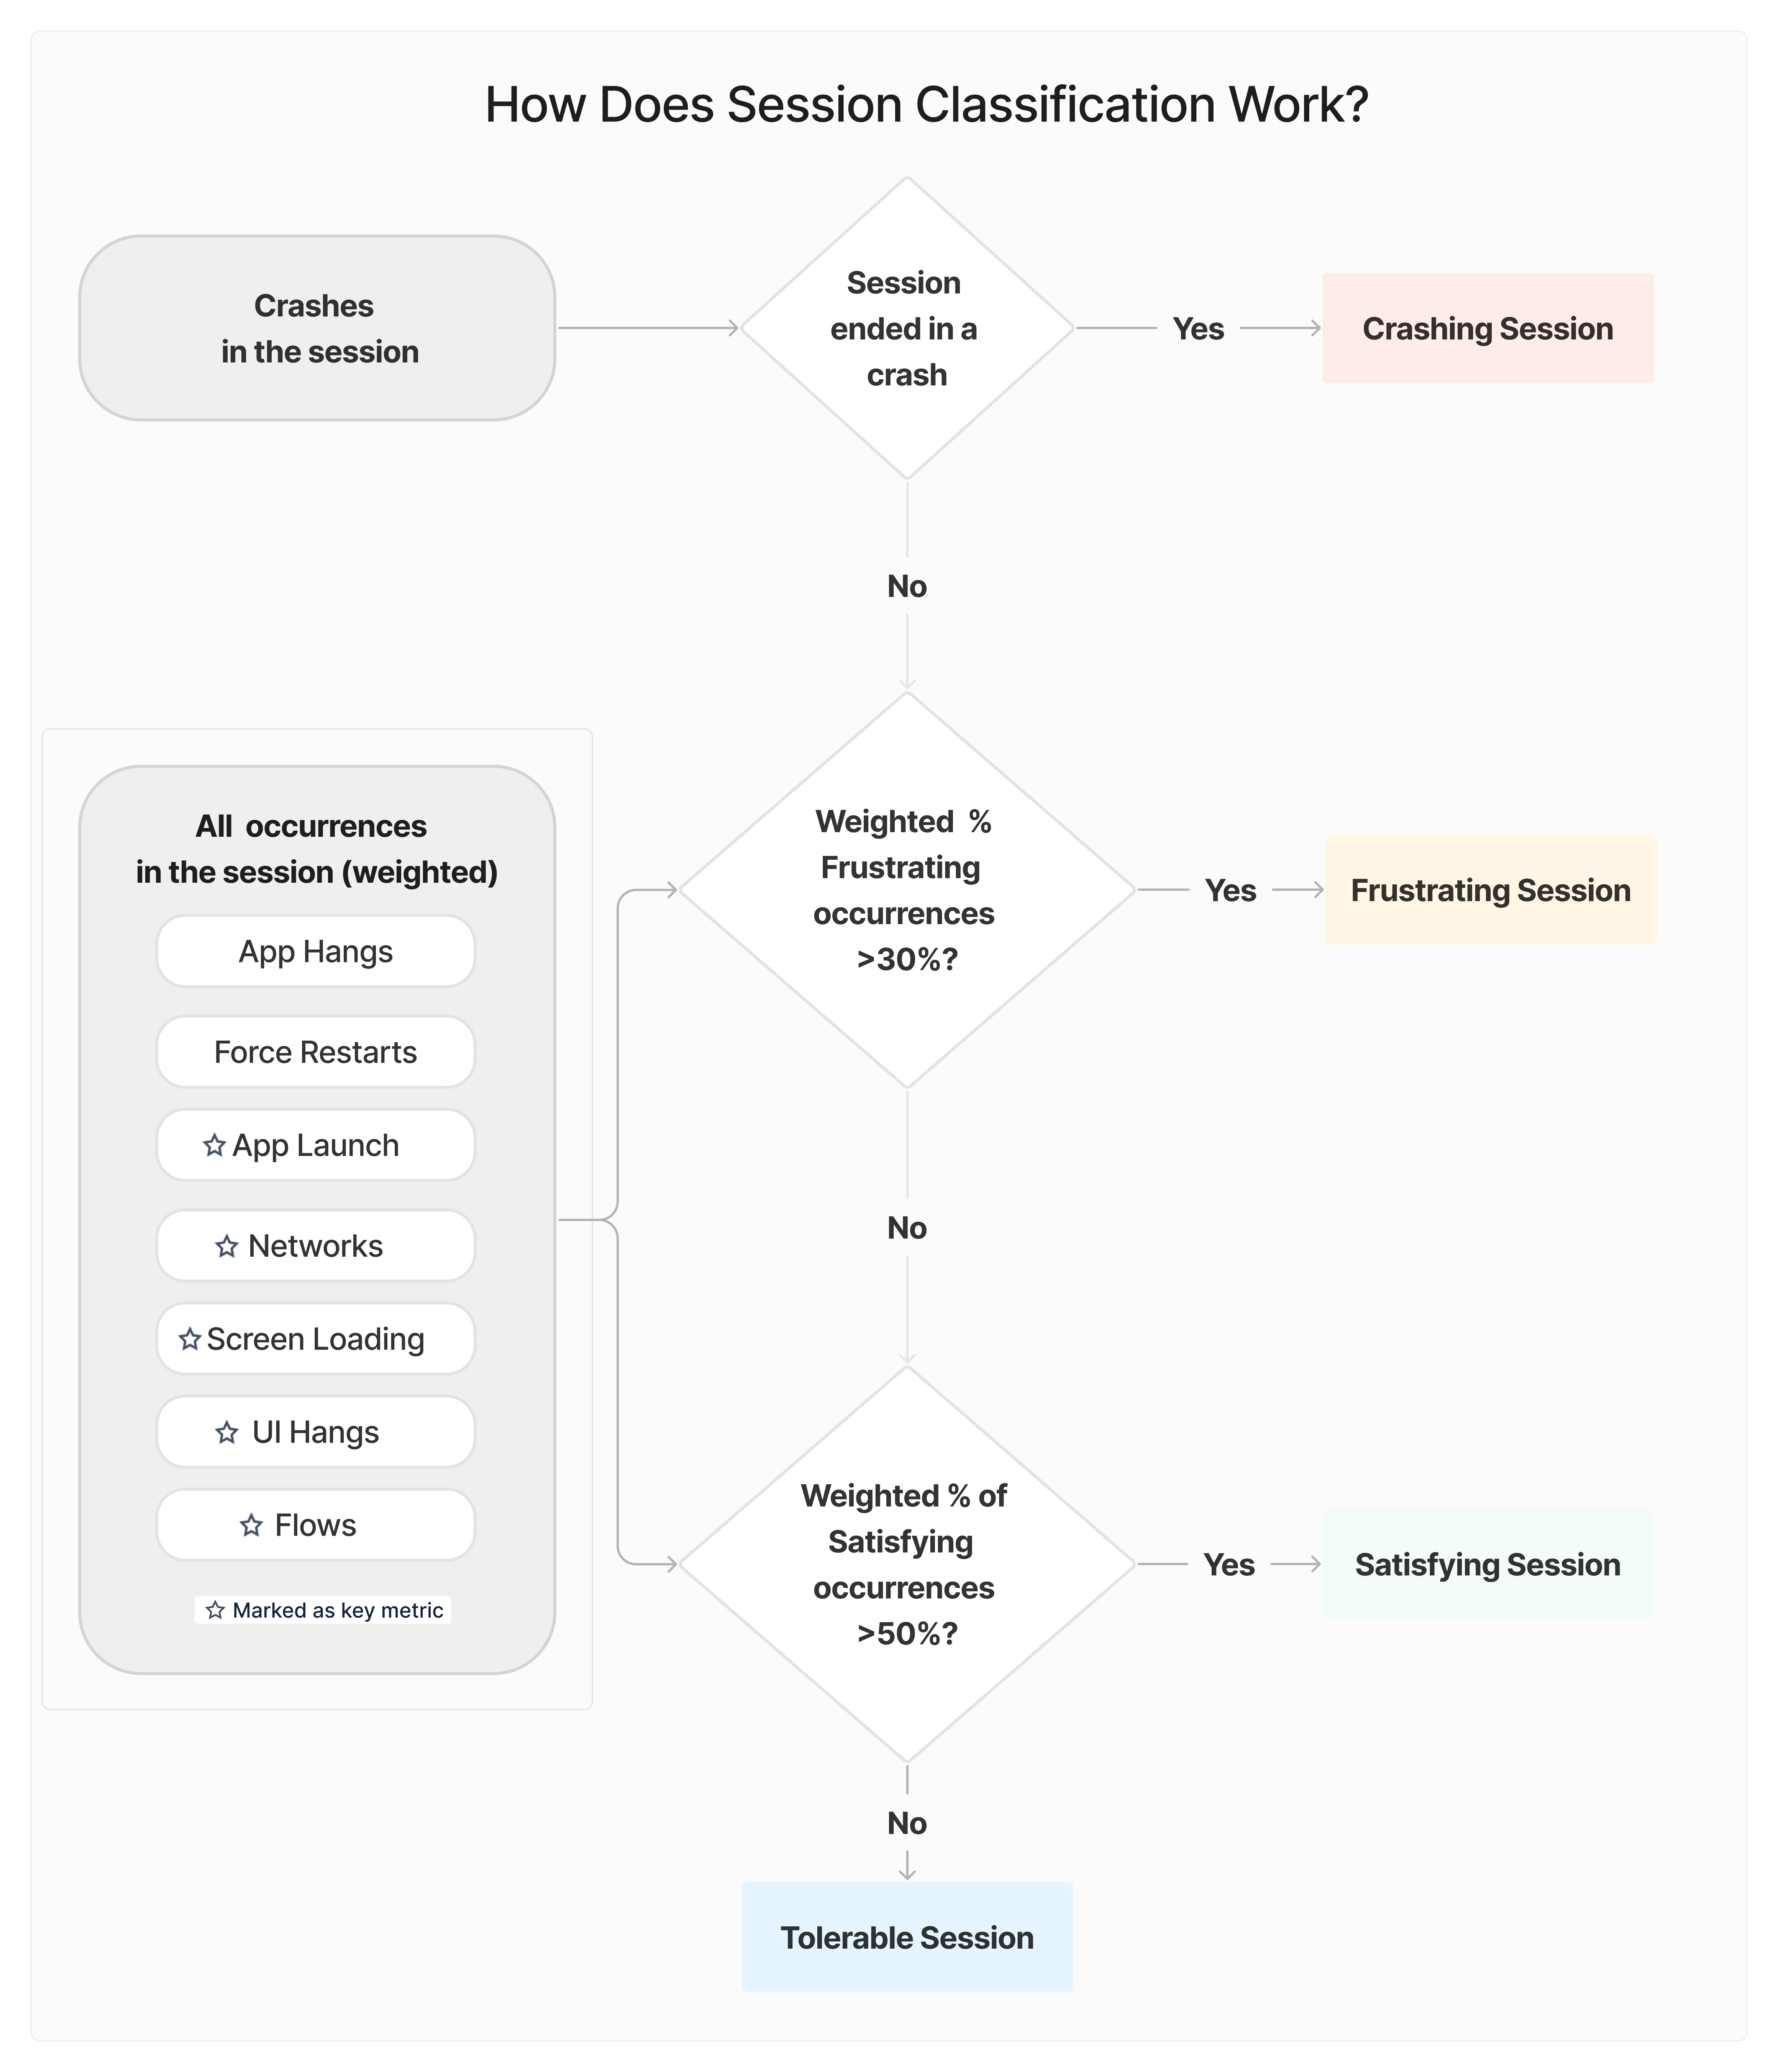
How Are Sessions Categorized?
Crashing Session: If a session ends with a crash or an OOM, it is classified as crashing.
Other Sessions: If a session does not crash, it is categorized as Frustrating, Tolerable, or Satisfying based on the issues that occurred during the session.
Example of Session Classification
Let's break down a session with multiple issues:
| Issue Type | Impact Level | Occurrences |
|---|---|---|
| App Hangs | High (an occurrence has a weight of 10 occurrences) | 1 (all app hang occurrences are considered frustrating) |
| Network Requests | Low (an occurrence has a weight of 0.3 occurrences) | - 2 Frustrating - 2 Tolerable - 1 Satisfying |
| App Launch | Medium (an occurrence has a weight of 1 occurrence) | - 3 Frustrating |
| Flows | Medium (an occurrence has a weight of 1 occurrence) | - 2 Satisfying |
Step 1: Calculate Weighted Counts
- Frustrating Count = (10 × 1) + (0.3 × 2) + (1 × 3) = 13.6
- Tolerable Count = (0.3 × 2) = 0.6
- Satisfying Count = (0.3 × 1) + (1 × 2) = 2.3
- Total Count = 13.6 + 0.6 + 2.3 = 16.5
Step 2: Calculate Weighted Percentages
- Frustrating% = 13.6 / 16.5 = 82%
- Tolerable% = 0.6 / 16.5 = 4%
- Satisfying% = 2.3 / 16.5 = 14%
Step 3: Classify the Session
- Frustrating Session → If Frustrating% ≥ 30%
- Satisfying Session → If Satisfying% ≥ 50%
- Tolerable Session → Otherwise
Since the Frustrating% is 82% which is over 30%, this session is classified as Frustrating.
How Is the Score Graded and Color-Coded?
| Score Range | Performance Level |
|---|---|
| ≥ 94% | Excellent (Green) |
| 85% - 93.9% | Good (Light Green) |
| 70% - 84.9% | Fair (Yellow) |
| 50% - 69.9% | Poor (Orange) |
| < 50% | Unacceptable (Red) |
Want More Control Over Frustration-Free Sessions?
You can customize how Frustration-Free Sessions is calculated to better reflect your app’s needs.
Updated 6 months ago