
Network for iOS
This page helps you get started with Instabug's network performance monitoring on iOS, understand apdex calculation, and customize URLs grouping for iOS apps.
Getting Started
Instabug App Performance Monitoring automatically captures your HTTP/S network requests when you're using the shared session. If some of your requests don't appear, you can follow the instructions below, depending on your setup: Custom Session Configuration, AFNetworking, or Alamofire.
Using Custom Session Configuration?
If you're using a custom NSURLSession or NSURLSessionConfiguration, add the following code snippet.
let configuration = URLSessionConfiguration.ephemeral
NetworkLogger.enableLogging(for: configuration)
let session = URLSession(configuration: configuration)
NSURLSessionConfiguration *configuration = NSURLSessionConfiguration.ephemeralSessionConfiguration;
[IBGNetworkLogger enableLoggingForURLSessionConfiguration:configuration];
NSURLSession *session = [NSURLSession sessionWithConfiguration:configuration];
Multiple NSURLSessions
Starting from SDK v11.0.3, Instabug supports multiple NSURLSession objects.
Using AFNetworking?
To enable network monitoring for AFNetworking, create the following class. Then use IBGAFURLSessionManager to create your requests.
// IBGAFURLSessionManager.h

#import <AFNetworking/AFNetworking.h>

@interface IBGAFURLSessionManager : AFURLSessionManager

@end

// IBGAFURLSessionManager.m

#import "IBGAFURLSessionManager.h"
#import <Instabug/Instabug.h>

@implementation IBGAFURLSessionManager

- (instancetype)initWithSessionConfiguration:(nullable NSURLSessionConfiguration *)configuration {
		[IBGNetworkLogger enableLoggingForURLSessionConfiguration:configuration];

    return [super initWithSessionConfiguration:configuration];
}

@end
Using Alamofire?
To enable logging for Alamofire, create the following class. Then use IBGSessionManager to create your requests.
import Alamofire
import Instabug

class IBGSessionManager: Alamofire.Session {
    static let sharedManager: IBGSessionManager = {
        let configuration = URLSessionConfiguration.default
        NetworkLogger.enableLogging(for: configuration)
        let manager = IBGSessionManager(configuration: configuration)
        return manager
    }()
}
Using Apollo?
To enable logging for Apollo, pass your session configuration to our NetworkLogger and Apollo client
import Apollo
import Instabug

class InstabugApollo {
    static let shared = InstabugApollo()
    lazy var client: ApolloClient = {
        let url = URL(string: "https://example.com")!
        let configuration = URLSessionConfiguration.default
        NetworkLogger.enableLogging(for: configuration)
        let store = ApolloStore(cache: InMemoryNormalizedCache())
        let client = URLSessionClient(sessionConfiguration: configuration)
        let provider = LegacyInterceptorProvider(client: client, store: store)
        let transport = RequestChainNetworkTransport(interceptorProvider: provider,
                                                     endpointURL: url)
        return ApolloClient(networkTransport: transport, store: store)
    }()
}
gRPC Support
Instabug supports the logging of gRPC requests. Depending on whether your codebase is Objective-C or Swift, a few different steps are required.
iOS minimum version
Logging gRPC requests is supported on iOS 10 and above.
gRPC Requests for Swift apps
To log gRPC requests in your Swift app, you'll need to add pod Instabug-gRPC-Swift to your podfile. Below you can find a few sample steps to assist with setting it up:
1- Import our destination: import Instabug_gRPC_Swift
2- Create an interceptor factory that confirms to the interceptor factory protocol that you have in your .grpc file
3- Make sure to return new instance of our interceptor InstabugClientInterceptor() in the methods that require being logged by Instabug
4- You can pass the port optionally in InstabugClientInterceptor as InstabugClientInterceptor(port: <#T##Int?#>) to see it on the dashboard
5- You can convert your model to Data by conforming to Encodable
6- You can pass the port optional in InstabugClientInterceptor as InstabugClientInterceptor(port: <#T##Int?#>) to see it on the dashboard
Below is sample code for the interceptor factory:
class ExampleClientInterceptorFactory: Echo_EchoClientInterceptorFactoryProtocol {
  // Returns an array of interceptors to use for the 'Get' RPC.
  func makeGetInterceptors() -> [ClientInterceptor<Echo_EchoRequest, Echo_EchoResponse>] {
    return [InstabugClientInterceptor()]
  }

  // Returns an array of interceptors to use for the 'Expand' RPC.
  func makeExpandInterceptors() -> [ClientInterceptor<Echo_EchoRequest, Echo_EchoResponse>] {
    return [InstabugClientInterceptor()]
  }

  // Returns an array of interceptors to use for the 'Collect' RPC.
  func makeCollectInterceptors() -> [ClientInterceptor<Echo_EchoRequest, Echo_EchoResponse>] {
    return [InstabugClientInterceptor()]
  }

  // Returns an array of interceptors to use for the 'Update' RPC.
  func makeUpdateInterceptors() -> [ClientInterceptor<Echo_EchoRequest, Echo_EchoResponse>] {
    return [InstabugClientInterceptor()]
  }
}

extension GrpcAutomation_RepeaterRequest: InstabugGRPCDataProtocol, Encodable {
    enum CodingKeys: String, CodingKey {
        case message, unknownFields
    }

    public func encode(to encoder: Encoder) throws {
        var container = encoder.container(keyedBy: CodingKeys.self)
        try container.encode(message, forKey: .message)
    }

    public var gRPCRequestData: Data? {
        let jsonEncoder = JSONEncoder()
        let data = try? jsonEncoder.encode(self)
        return data
    }

  //Finally
  let client = Echo_EchoClient(channel: channel, interceptors: ExampleClientInterceptorFactory())
gRPC Requests for Objective-C apps
To log gRPC requests in your Swift app, you'll need to add pod Instabug_gRPC_ObjC to your podfile. Below you can find a few sample steps to assist with setting it up:
1- Create an array of GRPCInterceptorFactory
2- Create a class that conforms to GRPCInterceptorFactory protocol
@interface GRPCFactory : NSObject <GRPCInterceptorFactory>
3- Override createInterceptorWithManager in GRPCFactory and return InstabugClientInterceptor
- (nonnull GRPCInterceptor *)createInterceptorWithManager:(nonnull GRPCInterceptorManager *)interceptorManager {
    InstabugClientInterceptor *interceptor = [[InstabugClientInterceptor alloc] initWithInterceptorManager:interceptorManager dispatchQueue:dispatch_get_main_queue()];
    return  interceptor;
}
4- Create a new instance of GRPCFactory and add it to the interceptors array
5- Create a new instance of GRPCInterceptorManager with the interceptorFactories array
6- Pass the manager to the factory instance
7- Finally pass interceptorFactories to options.interceptorFactories
Below is some sample code:
GRPCMutableCallOptions *options = [[GRPCMutableCallOptions alloc] init];

NSMutableArray<id<GRPCInterceptorFactory>> *interceptorFactories = [NSMutableArray new];

GRPCFactory *factory = [GRPCFactory new];
[interceptorFactories addObject:factory];
GRPCInterceptorManager *manager = [[GRPCInterceptorManager alloc] initWithFactories:interceptorFactories
                                                                previousInterceptor:nil
                                                                        transportID:GRPCDefaultTransportImplList.core_insecure];

[factory createInterceptorWithManager:manager];
options.interceptorFactories = interceptorFactories;
Trace Attributes
Sometimes, you may need to add additional data or attributes to your network traces. This can be done using the API below.
let urlPattern = "*.example.com/*"
let urlPredicate = NSPredicate(format: "SELF LIKE[c] '\(urlPattern)'")
APM.addNetworkTraceAttributesForURL(matching: urlPredicate, owner: self) { trace in
    return [
        "trace": "example"
    ]
}
[IBGAPM addNetworkTraceAttributesForURLMatchingPredicate:[NSPredicate predicateWithFormat:@"SELF LIKE[c] '%@'", @"*.example.com/*"]
                                                   owner:self
                                            usingHandler:^NSDictionary<NSString *,NSString *> * _Nullable(IBGNetworkTrace * _Nonnull networkTrace) {
    return @{
        @"type": @"example"
    };
}];
You can add up to 20 unique trace attributes per each trace.
Payload Size
By default, Instabug captures the payload size of the request and response; this should help with determining if the payload size could be causing any issues with network delays. The payload size is the size of the payload itself, so it does not include the header's size.
Instabug automatically buckets payload sizes into different buckets based on the distribution of the data per network group, with a minimum sensitivity of 10 bytes per bucket.
URL Patterns
URL patterns are used to group the relevant network call occurrences and aggregate their numbers. Let's take the following examples:
sample.com/list/3/item/1sample.com/list/3/item/2sample.com/profile/
It looks like 1 and 2 are the same request, but asking for different resources. While 3 is an entirely different one. Those three examples result in the following 2 URL patterns:
sample.com/list/*/item/*sample.com/profile/
What Are the URL Pattern Components?
- Plain text: works with exact string matching
*: matches with any URL part.*matches with only one part at a time. For example if you are mappingsample.com/part/variable1/variable2, your pattern should besample.com/part/*/*and notsample.com/part/*
Does Instabug Detect Patterns Automatically?
Instabug automatically detects numbers and hexadecimal tokens in your URLs and replaces them with *.
Can You Create Custom Patterns?
If you are using more complex URLs where variable parts may contain plain text and not only numbers and hexadecimal, we recommend defining your custom patterns. Just click on the "Create URL pattern" button in your network list.

Click on the highlighted action to create new URL patterns. URL patterns are used to group relevant network calls.
Here are a few examples:
| URL pattern example | Matches with | Doesn't match with |
|---|---|---|
sample.com/part1/part2 | sample.com/part1/part2 | sample.com/part1 |
sample.com/part1/* | sample.com/part1/part2 | sample.com/part1/part2/part3 |
sample.com/part1/*/part3 | sample.com/part1/part2/part3 | sample.com/part1/part3/part4sample.com/part1/part2/part3/part4 |
sample.com/part1/*/*/part4 | sample.com/part1/part2/part3/part4 | sample.com/part1/part2/part4sample.com/part1/part2/part3/part4/part5 |
sample.com/part1/*/*/* | sample.com/part1/part2/part3/part4 | sample.com/part1/part2/part3/part4/part5sample.com/part1/part2/part3 |
Some notes to consider while creating your URL patterns:
- Custom URL patterns that you define have higher precedence than the auto-generated ones. If the same call matches with a custom and an auto pattern, it gets grouped with the custom.
- At any point, you can delete a pattern to prevent grouping new calls with it.
- URL patterns shouldn't overlap. Each incoming network call gets grouped with only one pattern. In case of conflict, it gets merged with the newest pattern.
Creating or deleting patterns doesn’t affect your old data that has already been grouped. It only affects the upcoming network requests.
Network Calls Apdex
Instabug calculates an Apdex score for every network request (URL pattern) in your app. Apdex score ranges between 0 and 1. The higher the value, the closer you are to satisfying user experience:
- Apdex score ≥ 0.94 equates to Excellent performance.
- Apdex score ≥ 0.85 and < 0.94 equates to Good performance.
- Apdex score ≥ 0.7 and < 0.85 equates to Fair performance.
- Apdex score ≥ 0.5 and < 0.7 equates to Poor performance.
- Apdex score < 0.5 is considered Unacceptable.
How Is the Network Calls Apdex Calculated?
When a network call occurrence is collected, it is flagged based on a pre-defined target (T). A network call occurrence is considered:
- Satisfying: if its duration ≤ T
- Tolerable: if its duration > T and ≤ 4T
- Frustrating: if its duration > 4T or if it fails due to a server-side or client-side error.
Then based on the bucketing explained above, the Apdex is calculated:
Total occurrences = Satisfying occurrences + Tolerable occurrences + Frustrating occurrencesApdex score = (Satisfying occurrences + 0.5 * Tolerable occurrences) / Total occurrences
How Can You Control a Specific Network Call's Target?
By default, it is set to 0.5 seconds; however, you can easily change this number from your dashboard by clicking on the action highlighted in the screenshots below.

Click on the target CTA in the list to change the definition of satisfying response time.

Or, you can control it from the corresponding details page.
Please note that updating your response time target does not affect the already stored occurrences, only future occurrences will be flagged using the new target.
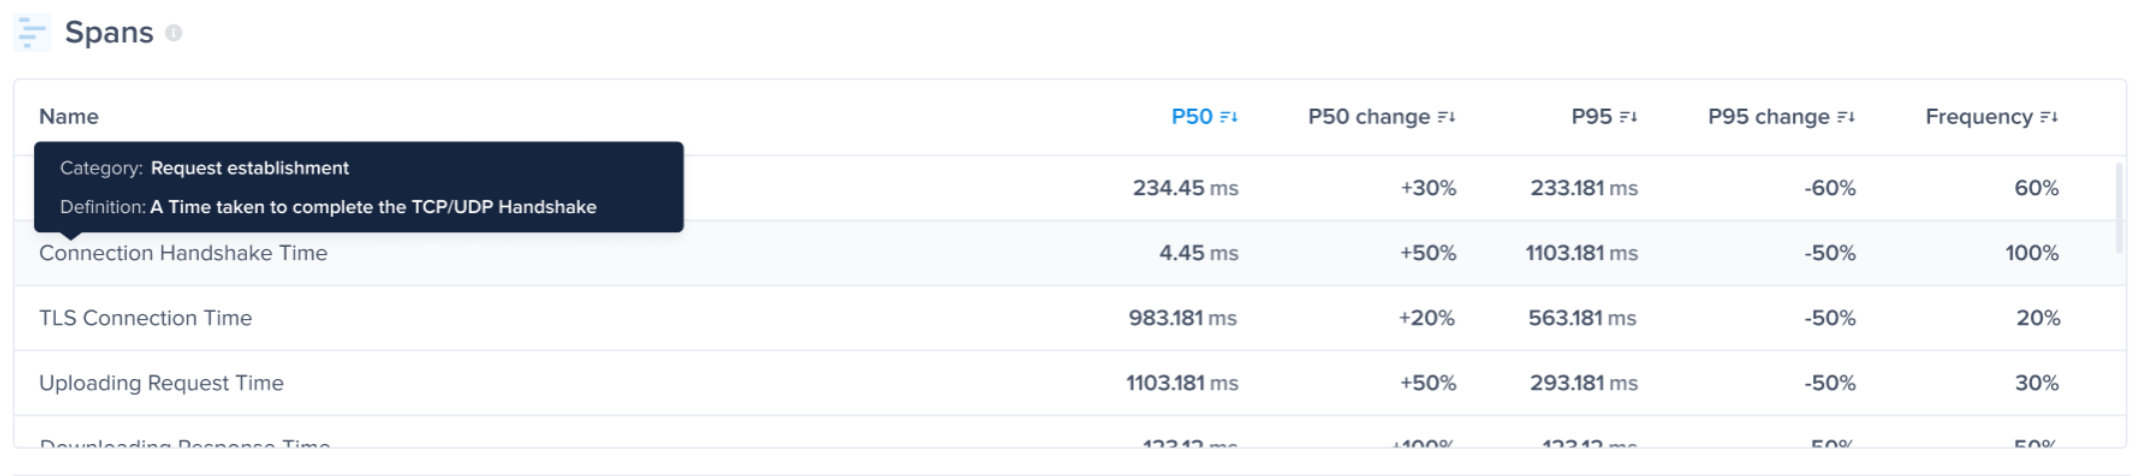
Network Latency Breakdown
You can see the P50s, P95s, and the frequency of each stage/operation that occurred inside a network group. These are the stages/operations that were made to send the network request and receive its response from the server.
The feature works out-of-the-box without any instrumentation, and the stages are shown inside the Spans table inside the Network metric.
The spans table contains the following stages:
- DNS Lookup
- Connection Handshake
- TLS Connection
- Uploading Request
- Downloading Response
- Server Processing
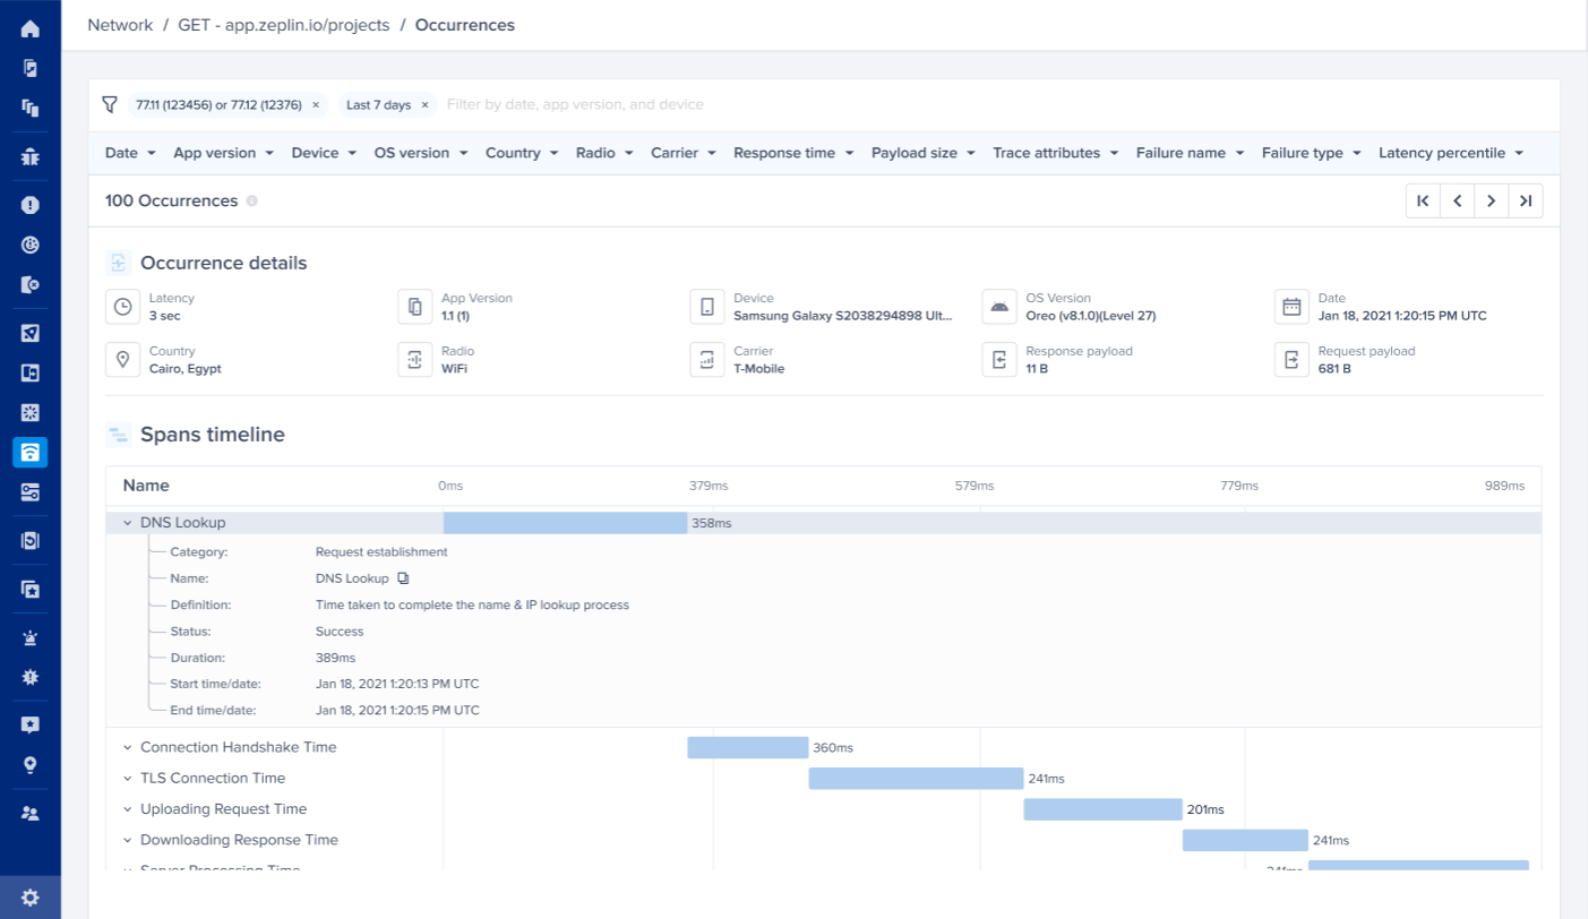
You can also see the breakdown and visualize the stages' timeline on an occurrence level inside the occurrences page.
Minimum SDK Version
The minimum required SDK version for this feature is v12.1.0.
Disabling/Enabling Network Performance Monitoring
When APM is enabled in your account, network monitoring works out of the box. If needed, you can disable it by calling the following API after initializing the SDK.
NetworkLogger.enabled = false
IBGNetworkLogger.enabled = NO;
Please note that disabling
NetworkLoggerwill disable Network Logs in Bug Reporting and Crash Reporting as well.
Updated over 1 year ago